6.2.2. Monitor Grid
List of Monitors
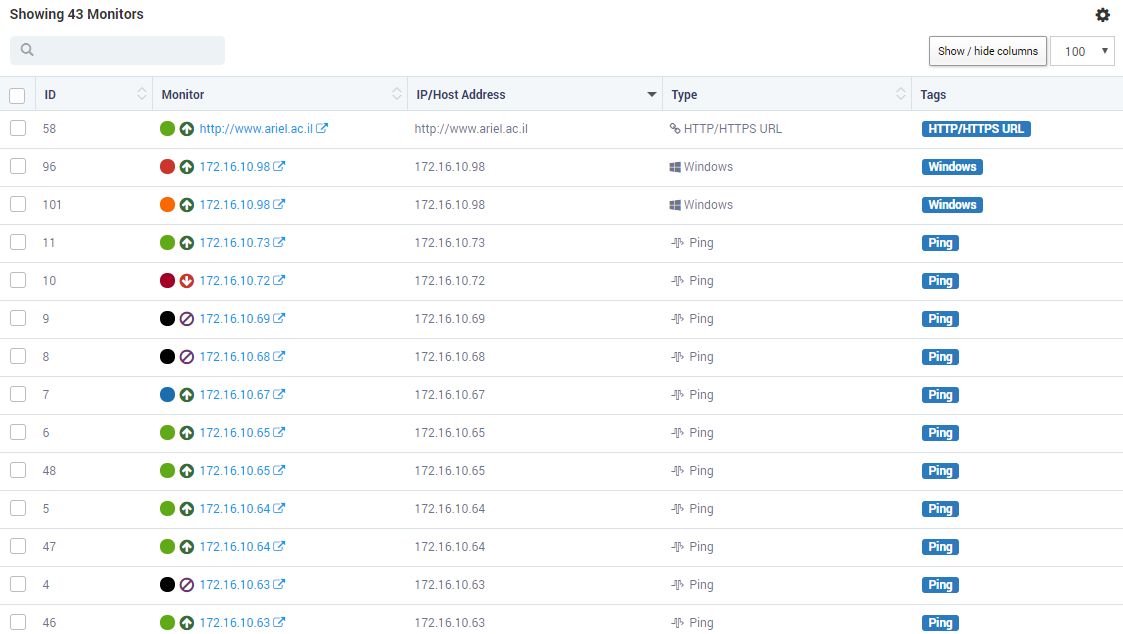
This section shows all the monitors filtered based on the monitor group. Some columns are visible by default while others are present in ‘Show/Hide Columns’.
Monitor Status |
Shows the symbol about availability of monitor.
|
Monitor Severity |
A color coded small circle shows severity about monitors. Default colors are:
|
IP/Host Address |
The host or IP address of the monitor. Click on the monitor name to open the slider. Or, click on the to open the monitor in a new tab. |
Type |
The device type of the monitor |
Tags |
List of tags associated with monitors. You selected these tags during device discovery |
ID |
Row ID of the monitor table. This is unique for each row and increments automatically |
externalRefId |
A reference value shows up here when monitors are imported from third party system using API |
Environment |
Shows the environment of the monitor. This is a custom field and available when you edit the monitor |
Location |
Shows the location of the monitor. This is a custom field and available when you edit the monitor |
Owner |
Shows the owner of the monitor. This is a custom field and available when you edit the monitor |
Group |
Shows the group of the monitor. This is a custom field and available when you edit the monitor |
Priority |
Shows the priority of the monitor. This is a custom field and available when you edit the monitor |
Latitude |
The geographical latitude coordinates |
Longitude |
The geographical longitude coordinates |
ClusterName |
Name of the cluster to which monitor belongs. This is used when monitors are imported using API. |
BlockName |
Name of the block to which the monitor belongs. This is used when monitors are imported using API. |