Widget Visualization
Visualization gives you a range of graphs and charts as a display output of the widget. The visualization is based on the type of metric you have selected.
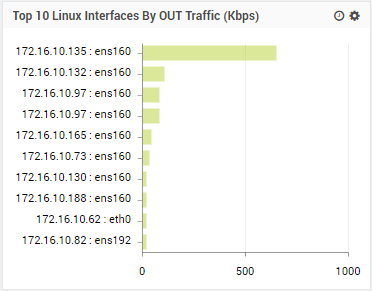
For example: A default widget shows ‘Top 10 Linux Interfaces by OUT Traffic (Kbps)’. For this it uses following visualization:

The output is:
Gauge View
- Gauge view: User can create a widget for getting data as per count, speed, traffic, (%) like this type of calculating the values of network device.
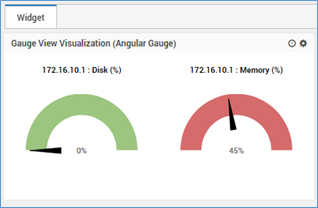
- Gauge view has the following visualizations.
- Metro Tile

- Cylinder Gauge
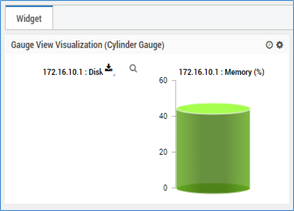
- Angular Gauge
- Extended Metro Tile
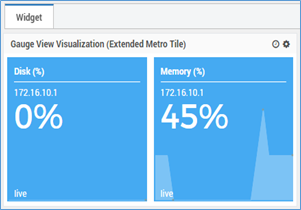
When the opacity is 0, the view will be greyed out (see pink and blue widgets). The greyed-out effect is available only on Motadata screen and not on exported files.
Historical View
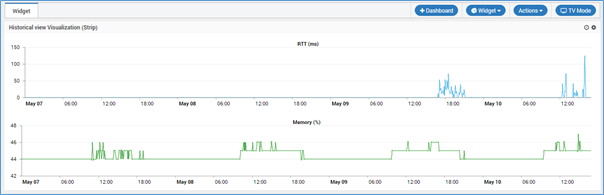
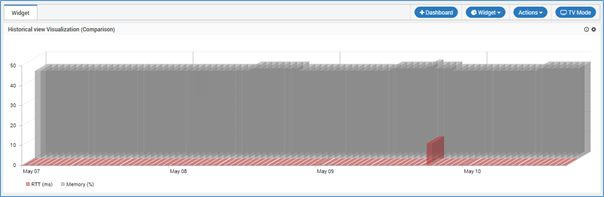
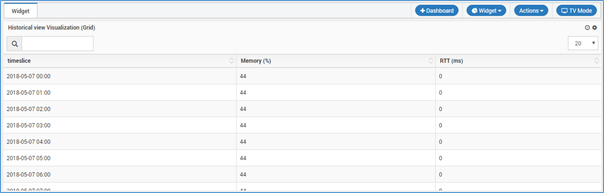
Historical view widget is designed for getting the previous details of network devices data. Historical view has the following visualizations.
- Strip View
- Compression View
- Grid View
Top N/Least N
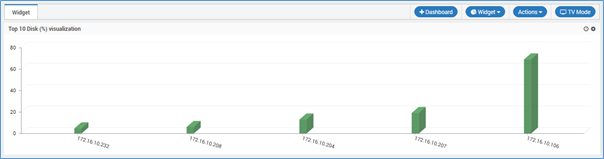
Top N/Least N widget are showing the Top or Least ordering data of the network device. Top N/Least N widget has different type of Chart type.
- Line
- Area
- Horizontal Bar
- Vertical Bar
- Horizontal 3D Bar
- Vertical 3D Bar
- Pie
- 3D Pie
- Donut
- 3D Donut
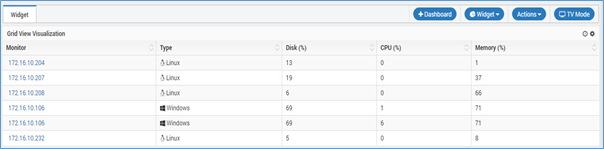
Grid View
Grid widgets are showing the all network devices data as List view or Grid view.
A parameter of flap history has been introduced in the grid view. If flap history is ‘yes’, a grid view showing the duration of each severity the monitor has been in individually will be generated and if ‘no’, a grid view showing the total duration of each severity the monitor has been in will be generated.
- Flap History Yes View
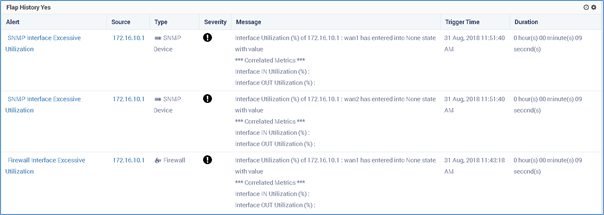
- Flap History No View

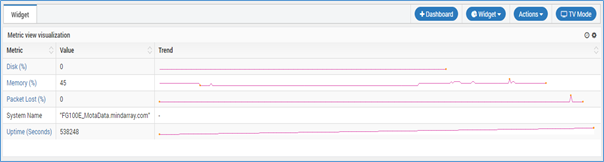
Metric View
Through the metric widget the user can get the all data with the metric value, severity, and trend.
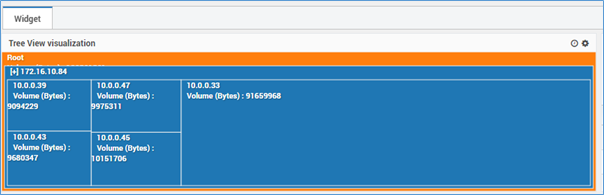
Tree View
Chord View
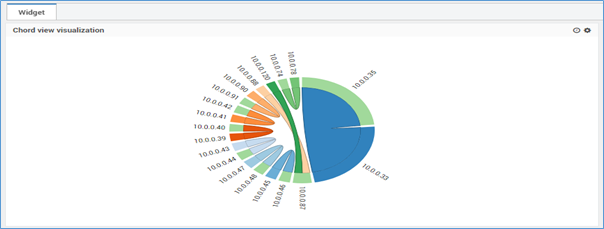
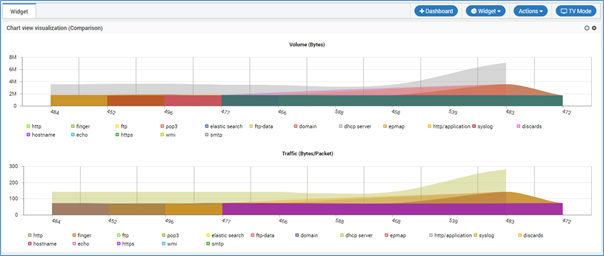
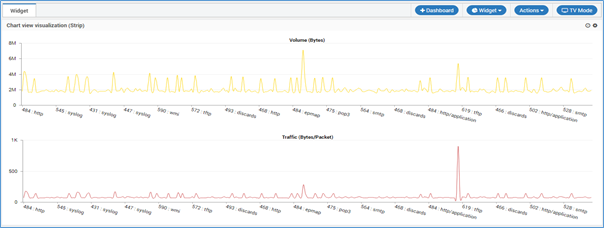
Chart View
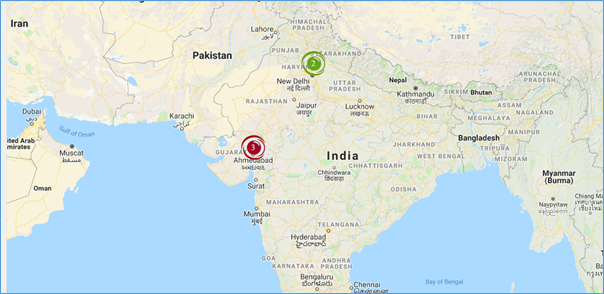
Map View
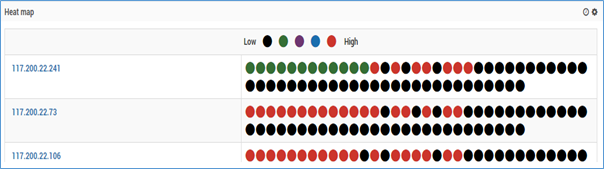
Heat Map View
Live View
Live view can be filtered on the basis of severity and alert name.

The status of the links will be visible on the dashboard only.