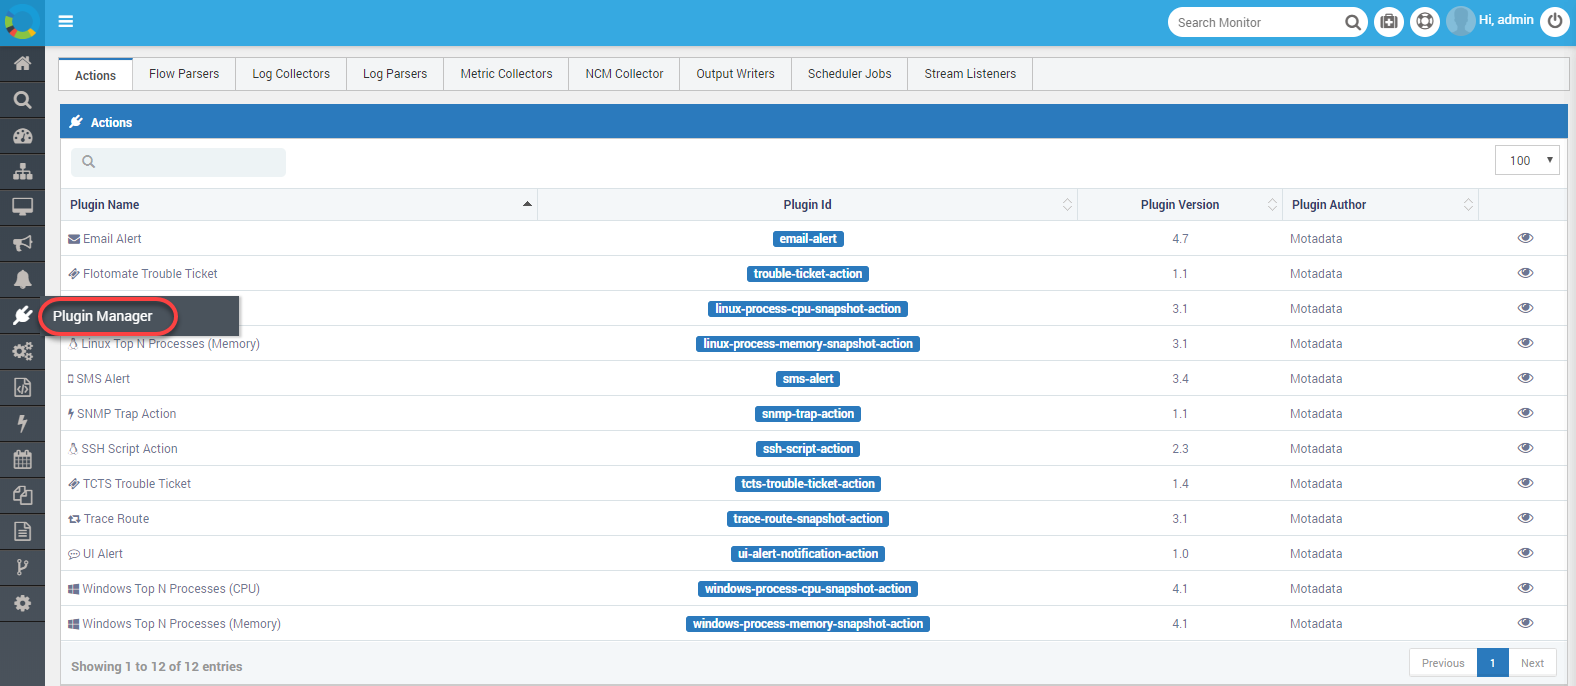
Plugin Manager
Plugin Manager menu helps you see all the plugins installed in your Motadata server. Plugins are the software components that performs a programmed set of actions like: parsing a set of data, running discovery (and collecting metrics from the discovered devices), performing scheduler jobs as defined by the user and all other set of actions. Motadata’s Plugin Manager comes with many pre-defined plugin categories. The plugins are nothing but the Motadata apps that you install from Admin section. After installing a new app, you can verify it’s version from plugin manager. You can also see the code running behind the plugin.
What Information Plugin Manager Shows?
| Plugin Name | Name of the plugin |
|---|---|
| Plugin ID | Unique ID of plugin. This helps you differentiate the plugins with similar names |
| Plugin Version | The version of the plugin. It is recommended to use latest version of plugin |
| Plugin Author | Default author is ‘Motadata’. Custom plugins will show different author name |
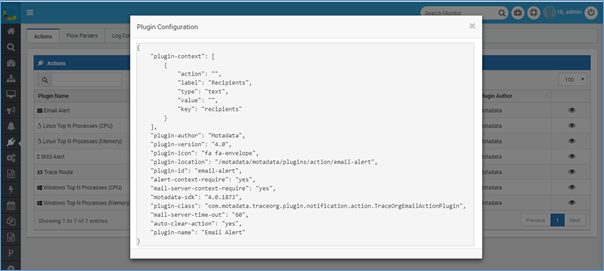
| View Code | Click on to see the code of the plugin. |
There are 100 plugins on a page by default. You can change the pagination to 10, 20, 50, 75 or 100.
The plugins are categorized based on their type. If you are new to system and don’t know about plugin types, you can search the plugin in individual tab. E.g. Metric related plugins information will display into Metric collectors tab. The search on each page shows results from same page only. The category description is as follows:
![]()
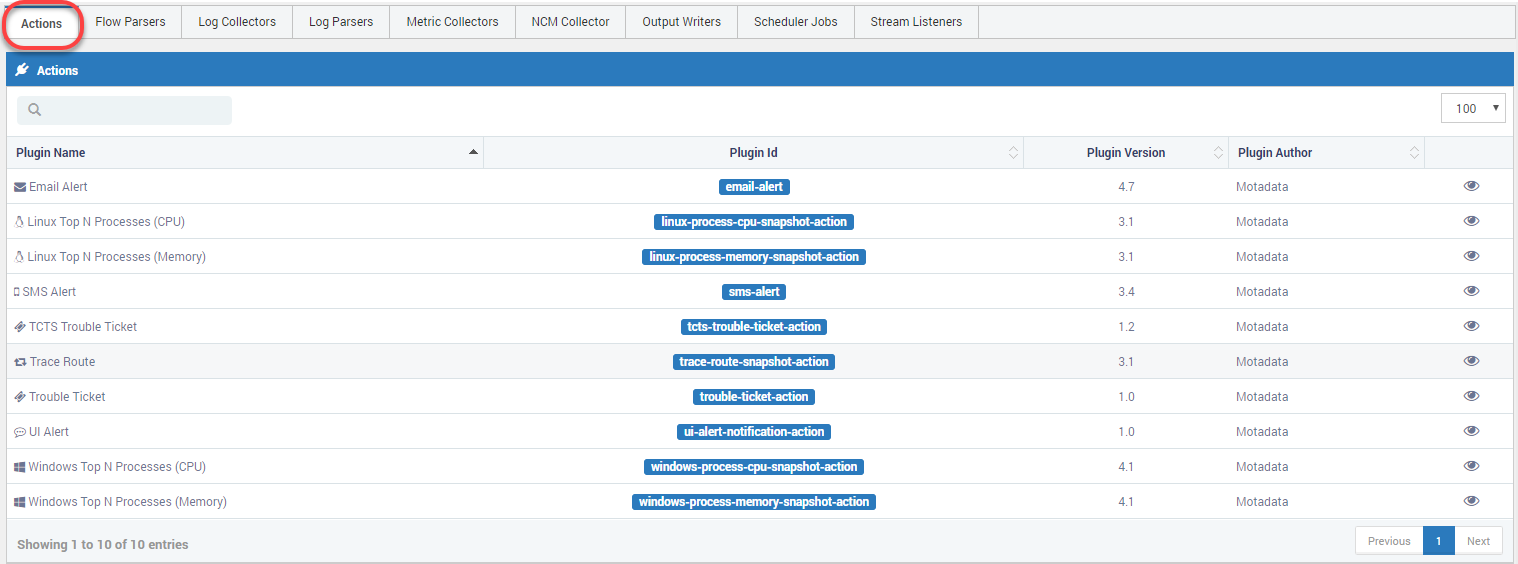
Plugin Actions
The plugins are associated with events. By default Motadata comes with many actions (e.g. Email alert and SMS alert etc). All notification related plugins are available in actions tab.
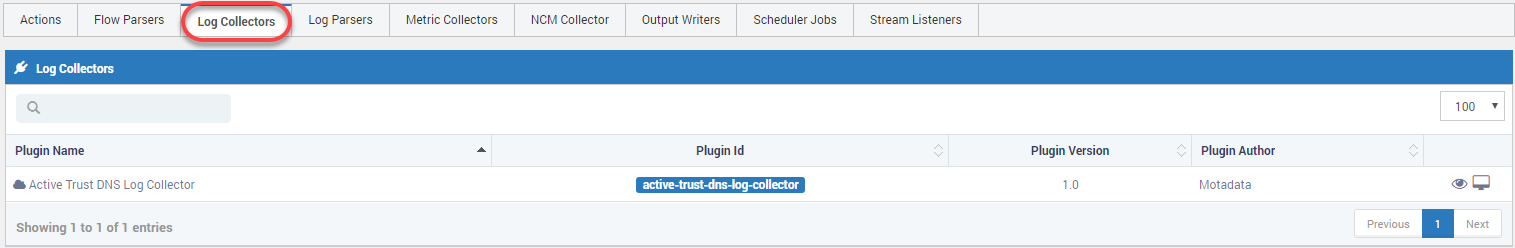
Log Collectors
The following Log Collectors are responsible for collecting the log information from your network. The plugins are important for:
- Motadata can receive logs from any specific agent such as host agent, Linux agent.
- Motadata can receive specific event log category by particular event ID, process ID, etc…
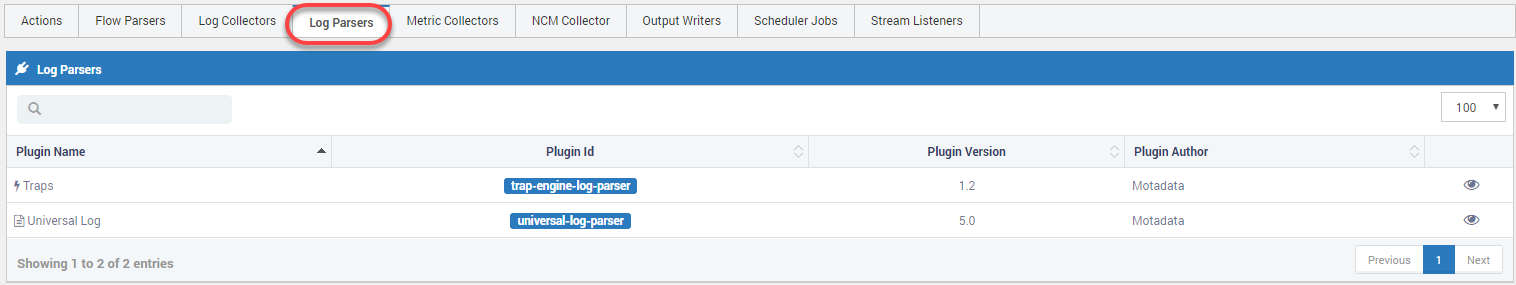
Log Parsers
The following Log Parsers are responsible for creating and showing meaningful information from the raw logs of your network. All the log related plugins are available in the log parser tab.
Metric Collectors
The following metric collectors are responsible for retrieving data that define the performance metrics of your network. All the metric related plugins are available in the metric collector tab.
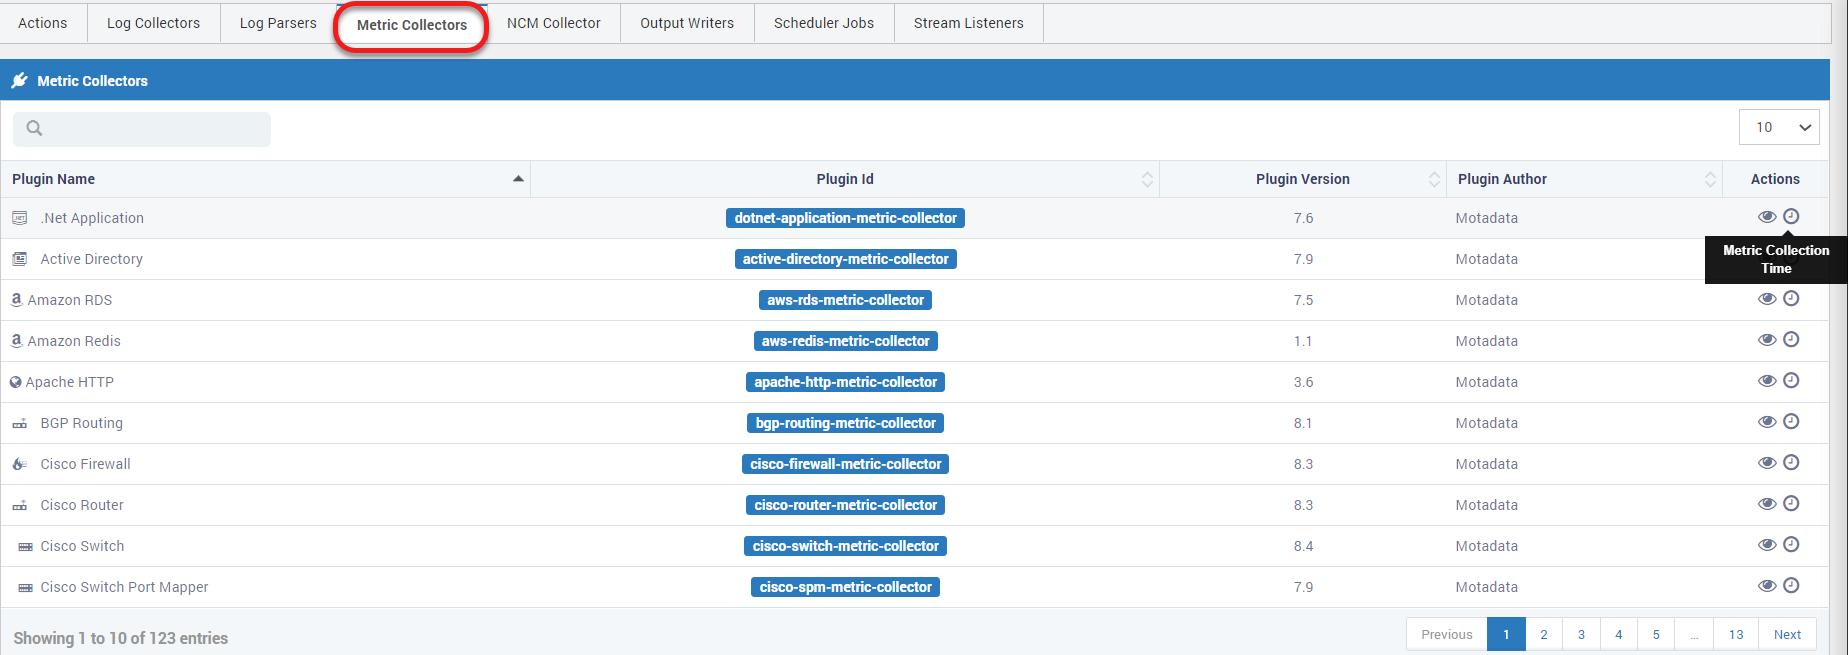
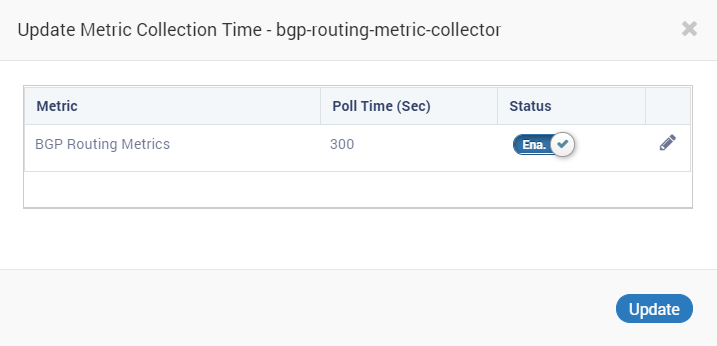
Here, an additional field of configuring Metric Collection Time is added, where you can Enable/Disable the status of particular plugin. Also, the polling time can be configured for the specific plugin with minimum timer of 30 Seconds.
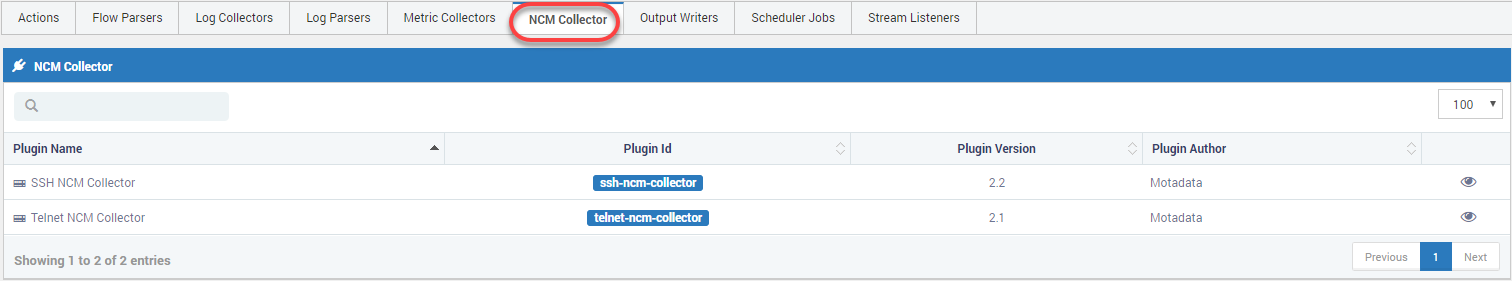
NCM Collectors
The following NCM collectors are responsible to configure backup/restore your network devices. All the NCM related plugins are available in the NCM collector tab.
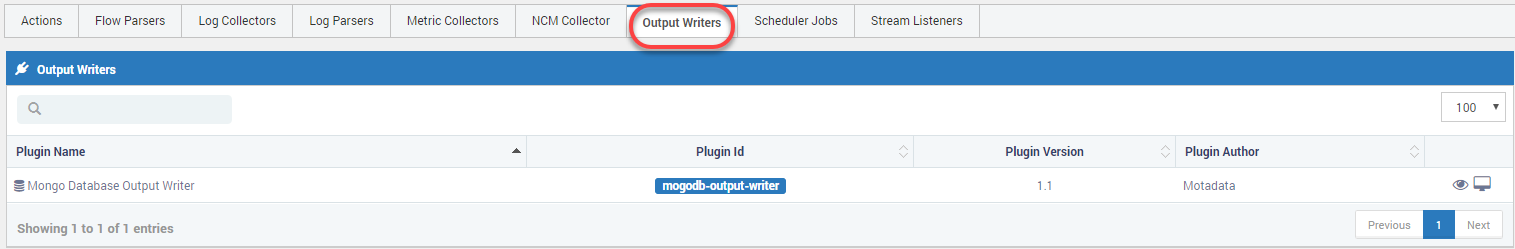
Output Writers
The following Output writers are responsible for forwarding any log, metric or alert data to a different database. All the ‘Output writers’ related plugins are available in the Output writers tab.
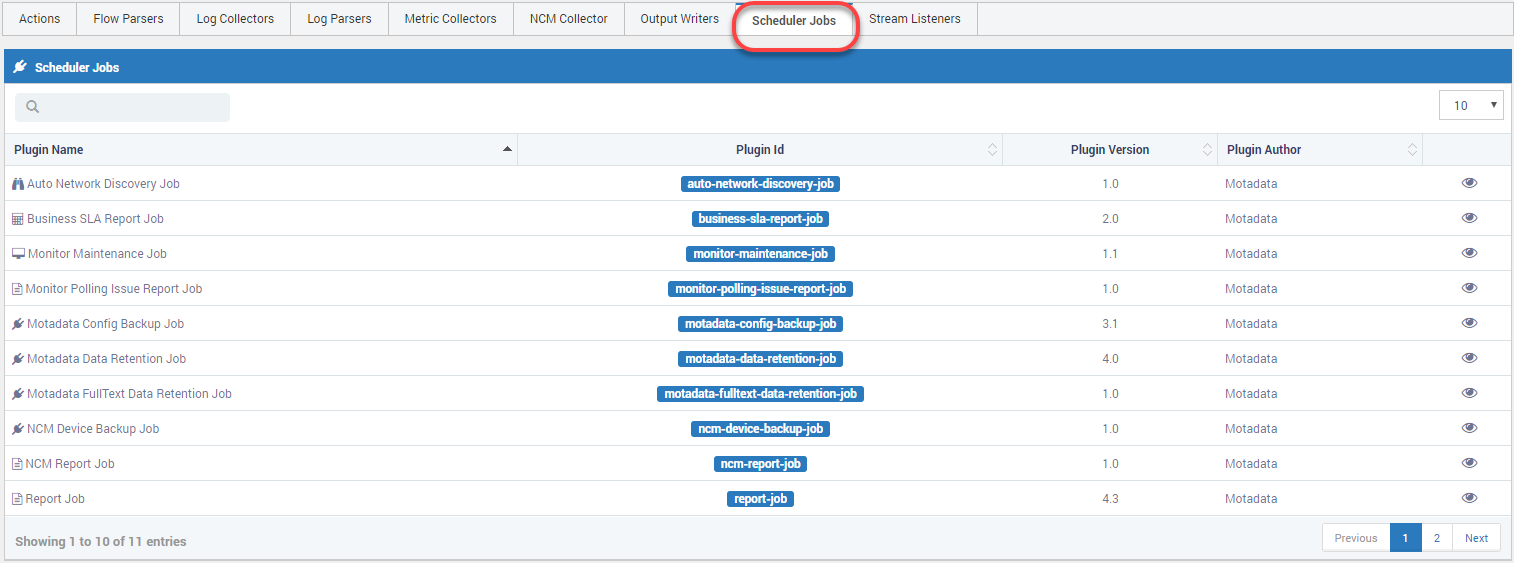
Scheduler job
The following Scheduler Job plugins are responsible to run a job at a scheduled time. If you go to schedulers section and click on any date few predefined scheduler jobs/categories appear by default. Those categories are customized in the back-end from here.
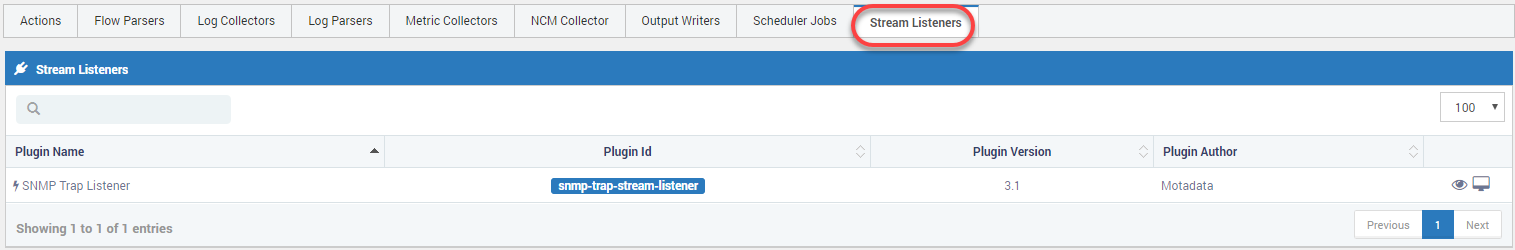
Stream Listener
The following Stream listener are responsible to generate SNMP trap and forward it to another system.