Network Interfaces
Under this tab you can see and analyze the comprehensive summary and top interfaces in a network.
You can use this tab also to identify the users, applications or protocols that use maximum bandwidth. By looking at interface performance and monitoring the incoming/outgoing traffic, you can easily identify the root cause of network slowness.
The section shows:
- Interface Summary Live
- Top 10 Interfaces by OUT Traffic (Live)
- Top 10 Interfaces by IN Traffic (Live)
- Top 10 Interfaces by Errors (Live)
- Interface Health
- Interface Recent Alerts
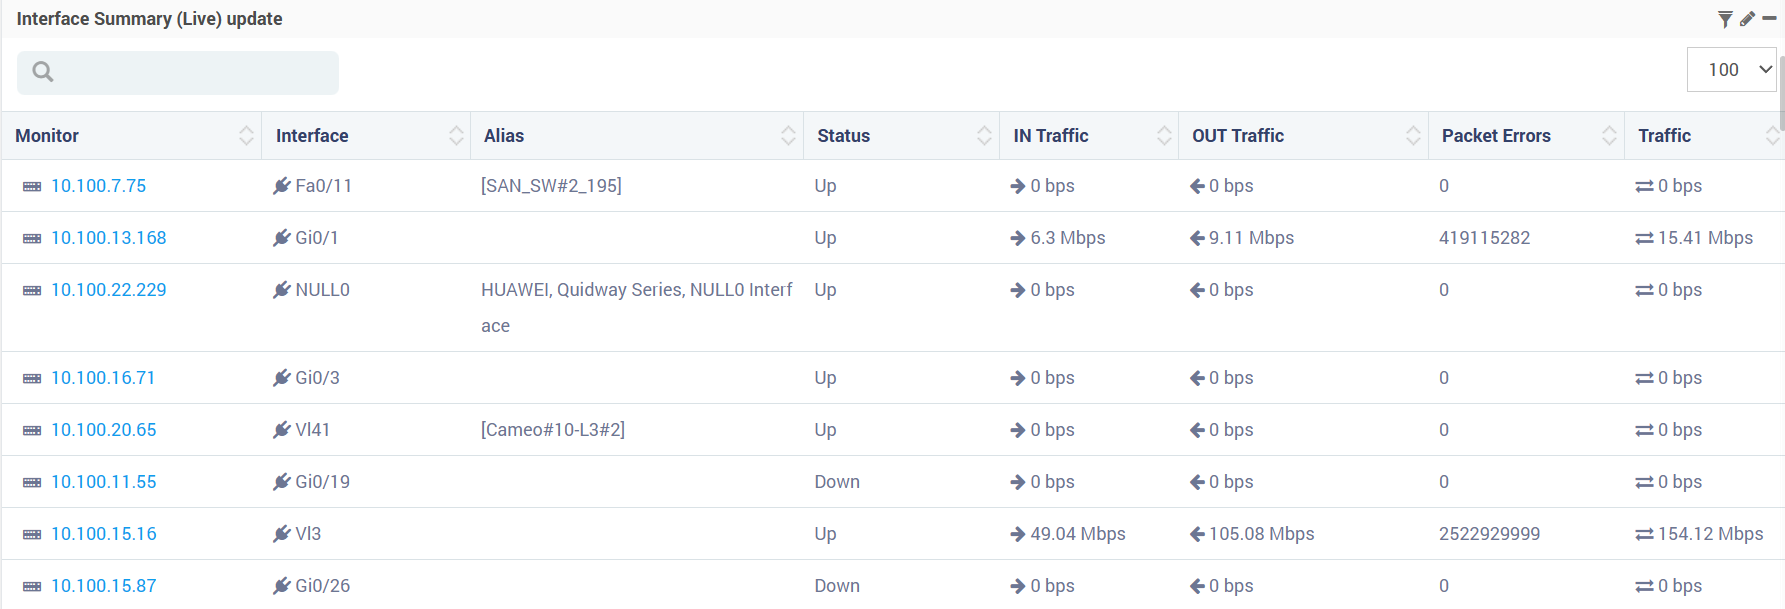
Interface Summary (Live)
You may have a look at the following parameters which deliver live data for every interface. This tab has 7 out of the box pre-defined widgets which are explained below.
- Monitor: This field lists the names of the monitors. Click on the IP address of the monitor to see the in-detail view for that particular monitor.
- Interface: This field lists the interfaces associated with monitor.
- Alias: Alternative name for the interface defined in Firewall. It is blank when no alias is defined.
- Status: Status of the interface: Up or Down.
- In Traffic: Total traffic entering the interface.
- OUT Traffic: Total traffic exiting the interface.
- Packet Errors: Total number of packet errors.
- Traffic: Overall network speed associated with the interface. It is calcuated based on traffic transfer between two interfaces per unit second.

Additional Read: Widget Options