6.3.5. Monitor Actions
Individual Monitor Actions are available for every monitor (in monitor’s details page). The actions are:
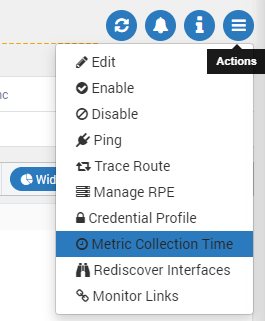
Monitor Actions for Individual Monitor
6.3.5.1. Edit
Edit the monitor by changing its properties on monitor’s IP address.
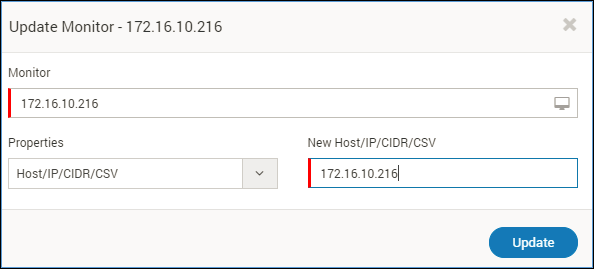
Update the Metric Name and details
6.3.5.2. Enable
This will enable the monitor. If you enable a monitor, Motadata will start polling its details. By default all monitors are enabled.
6.3.5.3. Disable
If you disable a monitor, Motadata will stop polling its details.
6.3.5.4. Ping
This is used to ping a monitor to know if the device is up or down. Ping details are as:
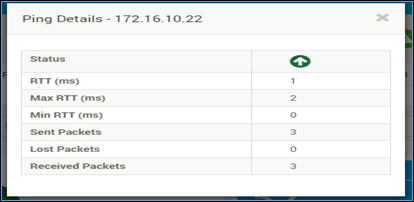
Ping details
6.3.5.5. Trace Route
You can find the hop count and RTT in MS if you trace route for the destination monitor.
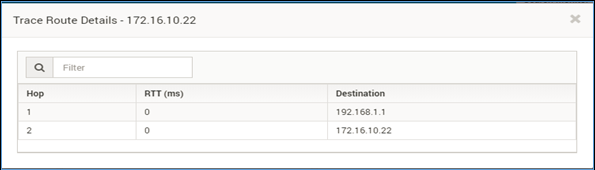
Trace Route information
6.3.5.6. Manage RPE
RPE servers in Motadata are configured to be used either as standalone or in fail-safe approach. Based on your Motadata’s configuration, you’ll see either of the two options:
Either you’ll be able to select only 1 RPE from the list.
Or you’ll be able to select multiple RPE servers from the list.
- The standalone mode is the legacy mode where you select which RPE should poll the monitor. In this fashion, you can assign only 1 RPE to the monitor. There are two choices while selecting the RPE:
Select Master RPE
Select Client RPE
Note: Before moving from legacy RPE to fail-over Lite RPE configuration (or vice versa), move all your monitors to master RPE. Motadata uses Disconnect Timeout value (say 5 minutes) to determine the availability of RPE. If the client RPE doesn’t revert with poll data for 5 minutes, Motadata will consider it as down.
In Lite mode, you can select either master RPE server or multiple client RPE servers to poll your monitor. When client RPE servers are selected, Motadata uses round robin fashion to select RPE. This way when one RPE server is down, monitor is polled through another server. You can select list of client RPE servers that will be used for polling.
You can manage the RPE Admin > Distributed Monitoring
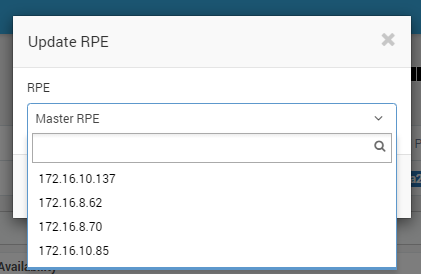
List of RPE in Standalone RPE Mode
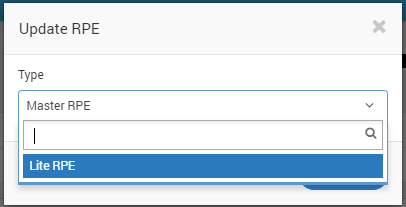
Select Master or Lite RPE in Lite RPE Mode
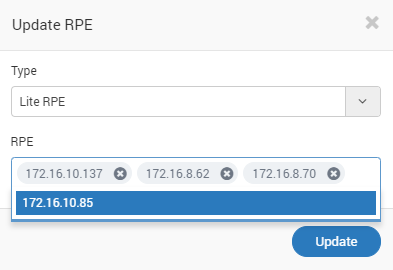
Select multiple monitors for Lite RPE fashion
6.3.5.7. Credential Profile
Assign credential profile for selected monitor. Credential profile comes into place during Network Discovery Settings.
Assign Credential Profile
Credential Profile List View
6.3.5.8. Metric Collection Time
Admin can configure metric collection time based on the criticality of device type. Motadata will poll the monitor at your defined interval. By default the metric collection time is set as 300 seconds. Motadata supports upto 30 seconds of metric collection time to monitor critical devices. Click on the metric collection time and Motadata will display the current settings in a popup. Edit the settings to define new collection time.
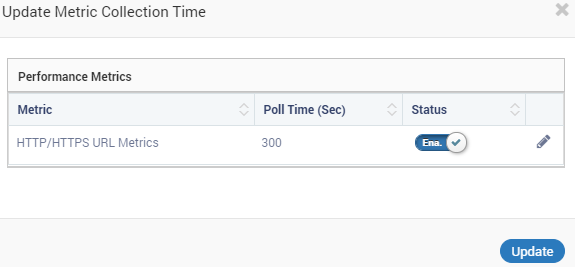
Metric Collection Time
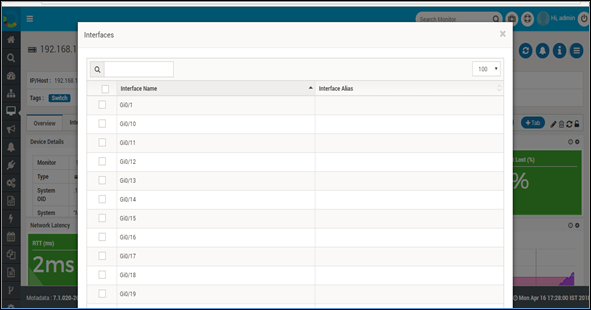
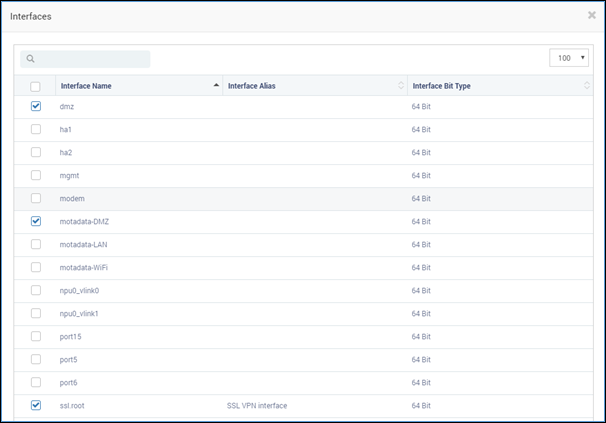
6.3.5.9. Rediscover Interfaces
This section provides a functionality to discover only selected interfaces. For the first time, all interfaces will be displayed.
To rediscover a particular interface:
Select Monitor > Actions > Rediscover Interfaces. select the interfaces you want to discover.
The interface polls both 32 bit and 64 bit interfaces (only applicable for SNMP)
Click Update.
System will poll selected interfaces only.
Selected interfaces will display in interface tab.
Rediscover Interfaces - Interface Selection Screen
Rediscovered Interfaces in Interface Tab
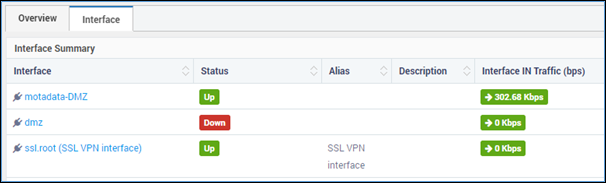
6.3.5.10. Monitor Links
Here, the link status of the primary monitor (router) can be viewed. When other monitors are linked with the primary device the status of the device needs to be monitored. As shown below we can see the primary device’s present details and status:
Monitors linked
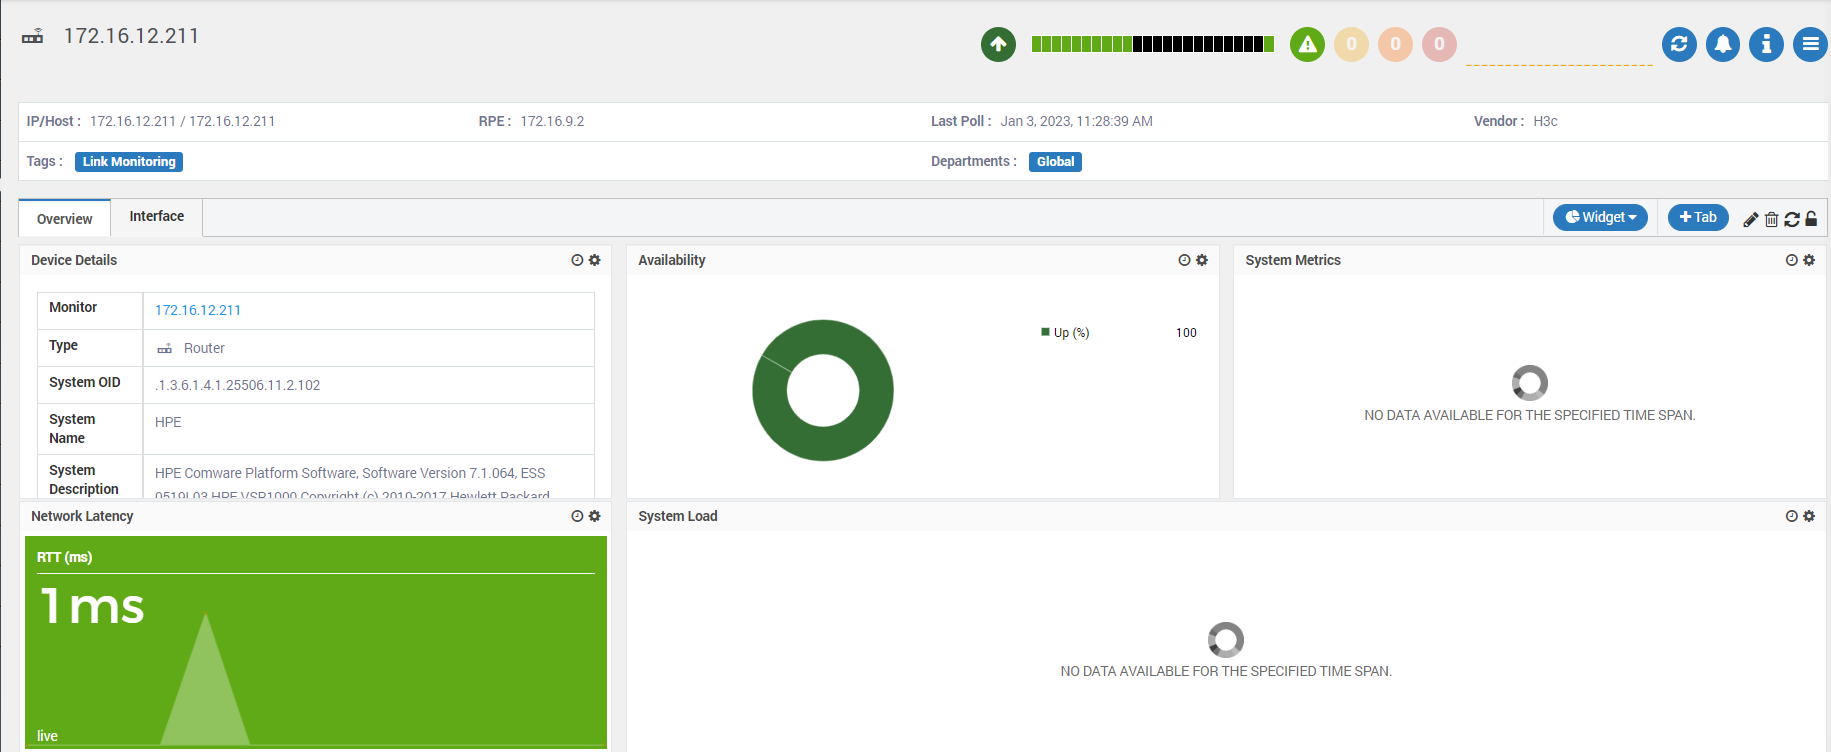
When the option of the Monitor Links in details page is clicked, it redirects to the available linked devices for monitoring. Here, the tags can also be associated with the monitors as per the requirement.
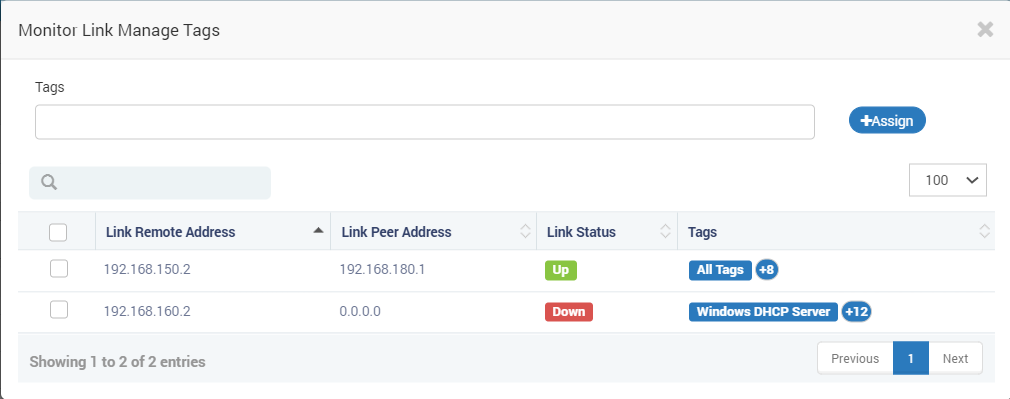
Monitor links page