ObserveOps Health Monitoring Screen
The Health Monitoring screen gives you a centralized view of your ObserveOps deployment's health and performance. From one screen, you can monitor live sessions, review database and cache statistics, and manage backups and upgrades.
Navigation
Select the Health Monitoring icon  visible on any screen.
Performance and Health
Monitor the internal state of your ObserveOps deployment, database performance, and application server metrics.
- Health Overview
- Application
- Database
Health Overview
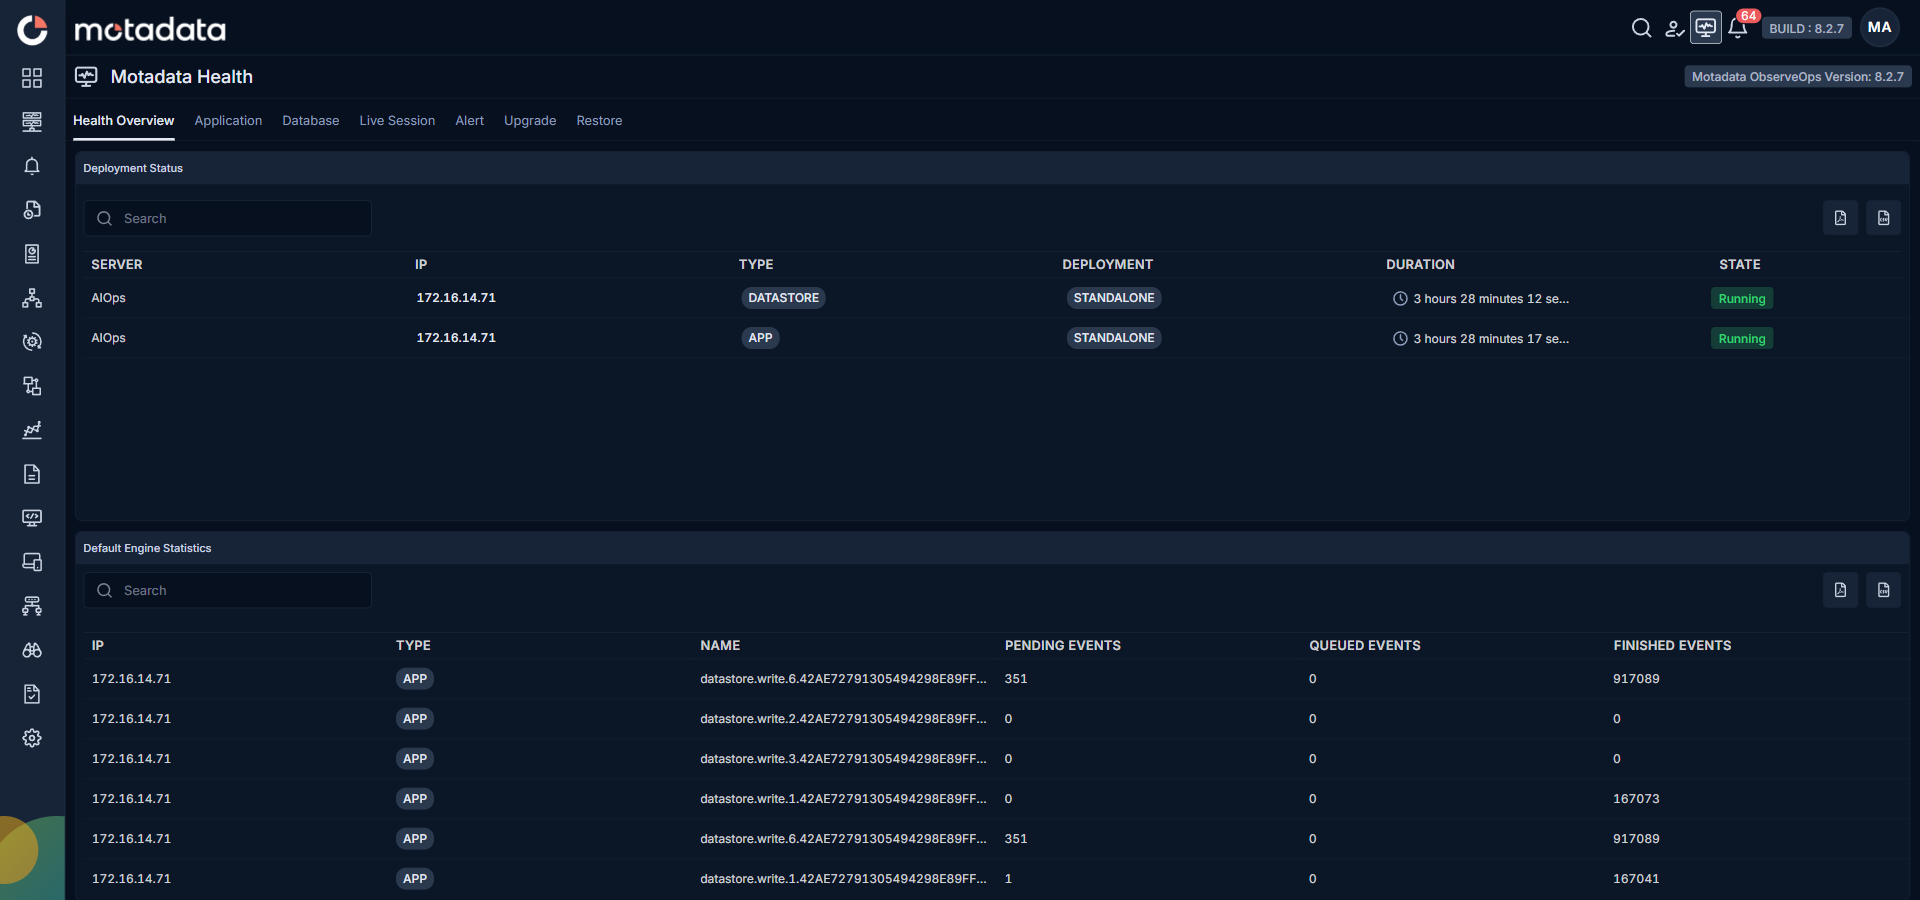
The Health Overview tab gives you a snapshot of your ObserveOps deployment's current health. Three widgets display the key status indicators.
| Widget | Description |
|---|---|
| Deployment Status | Health status of all installed components: Master Application Server, database, and collectors. Identify which component has an issue at a glance. |
| Engine Statistics | Metrics for each processing engine: Metric Poll, Notification, Config Create, Rediscover, and Event Policy. Shows dropped events, pending events, queued events, finished events, and idle workers. |
| Monitors (Polling Issue) | Monitors currently experiencing polling failures. Shows group, tags, monitor type, and the reason for failure so you can fix polling issues before they affect data collection. |
Application
The Application tab shows JVM (Java Virtual Machine) performance metrics for your application servers.
Select the entity from the dropdown in the top-right corner, for example the primary or secondary application server, to view metrics specific to that server. You can also download diagnostics data from this tab for offline analysis.
| Field | Description |
|---|---|
| Thread Count | Current number of active threads in the JVM. |
| Daemon Threads | Number of daemon threads running in the JVM. |
| Heap Memory | Used and committed heap memory currently in use by the JVM. |
| Non-Heap Memory | Used and committed non-heap memory currently in use by the JVM. |
| Init Memory | Initial memory allocated to the JVM at startup. |
| Max Heap Memory | Maximum heap memory allocated to the JVM. |
| Garbage Collection Summary | Grid view of GC events, count and duration per GC cycle. |
| Non-Heap Memory Trend | Graph of non-heap memory usage for the current day. |
| Heap Memory Trend | Graph of heap memory usage: today's data plus a 7-day comparison. |
| Port Collection Summary | Source and destination IPs for application, datastore, and collector servers, with port number, port status, and duration. |
Database
The Database tab shows health and performance metrics for your ObserveOps databases.
Select the database from the dropdown — primary, secondary, or replica — based on your deployment configuration. The metrics update to reflect the selected database. You can download diagnostics data for the selected database directly from this tab.
| Widget | Description |
|---|---|
| Cache Details Widget | Cache performance metrics for the selected database: cache entry count, hit ratio, cache touches, and average access time. |
| Graphical Widget | Visual graphs for key database metrics: top queries by execution time, pending queries, total queries, pending files to sync, and query latency. |
Session and Operations
Track active user sessions, review infrastructure alerts, and manage backup and upgrade workflows.
- Live Session
- Alert
- Restore
- Upgrade
Live Session
The Live Session tab shows all active user sessions currently running on the platform in real time.
| Field | Description |
|---|---|
| User Name | Name of the user logged into the session. |
| User Type | Type of the user logged into the session. |
| Remote IP | IP address from which the session was initiated. |
| OS | Operating system running on the user's device. |
| Browser | Web browser used to access the session. |
| Duration | How long the session has been active. |
Alert
The Alert tab shows alerts triggered on ObserveOps infrastructure, application servers, databases, and collectors.
| Field | Description |
|---|---|
| Policy Name | Name of the policy that triggered the alert. |
| Type | Type of the alert policy. |
| Metric | Metric for which the policy fired. |
| Instance | Specific instance for which the alert fired, if applicable. |
| Monitor | Monitor associated with the alert. |
| Value | Metric value at the time of the alert. |
| Incident Details | Details of the incident linked to the alert. |
| Last Seen | Timestamp of when the alert was last observed. |
| Duration | Total time the alert has been active. |
| Note | Additional notes or comments added to the alert. |
Restore
Refer to Restoring Backups for the full restore workflow.
Upgrade
Refer to Upgrade Overview for the full upgrade workflow.