5.1. OLT
5.1.1. Filtering Option
Using filters you can trim down the OLT inventory for a specific inventory list. The filters are dependent to each other. It works as follows:
- Select Package: Select the package from the list. Based on the package, Island drop-down will show related values.
- Select Island: Select the island from the list. Based on the island, Taluka drop-down will show related values.
- Select Taluka: Select the taluka from the list. Based on the taluka, EMS name will show related values.
- Select EMS Name: Select the EMS name from the list.
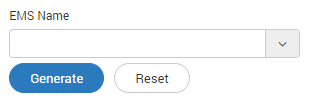
EMS Name Filter
Click on ‘Generate’ to filter the monitors.
5.1.2. Inventory List
Based on the group and filter selected, all the available monitors will show in the list.
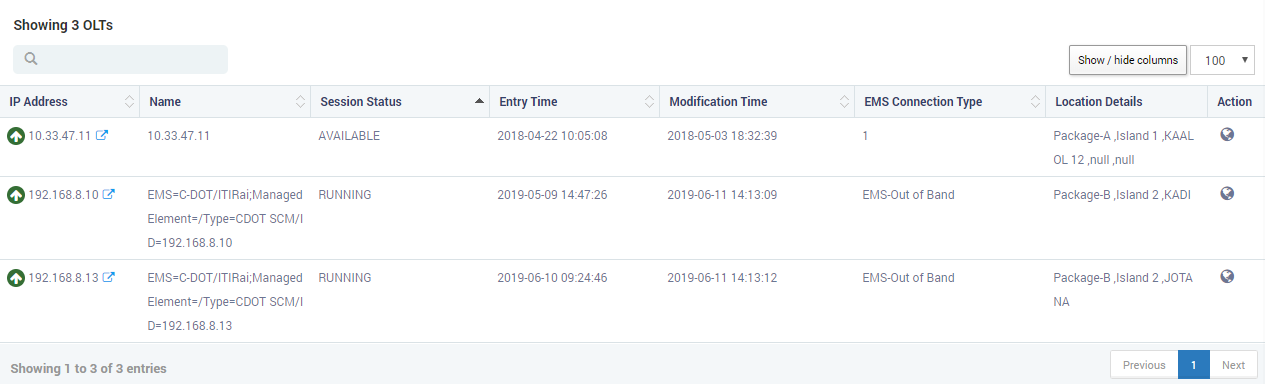
OLT List
| Field Name | Description |
| OLT IP | The column shows IP address and availability of the devices. The arrow shows the availability of device.
|
| Name | Shows the name of the monitor. |
| Session Status | Shows the session status of the monitor. |
| Entry Time | Shows the entry time of the monitor. |
| Modification Time | Shows the timestamp when the monitor was modified. |
| EMS Connection Type | Shows the type of the EMS connection. |
| Location Details | Shows the location where monitor is located. |
5.1.3. Set Location of Device
When new OLT devices come into inventory, you have to add the location details of the devices. You can also update the location details of existing device. To add/update the location, click on the ‘Location Config’ button. A popup will open up.
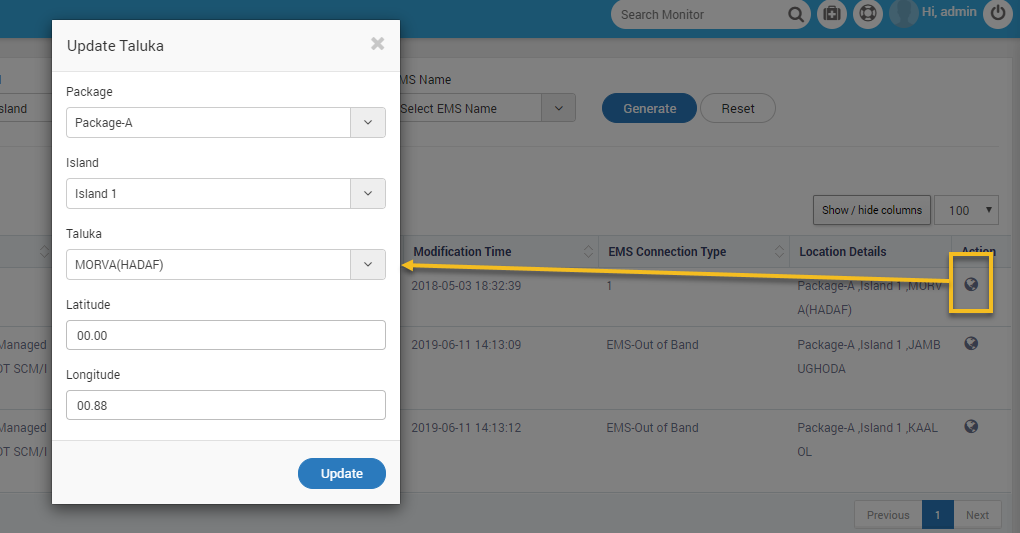
Set Location Details
Similar to filters, all the drop-downs are dependent drop-downs. If you don’t find the Taluka, try changing the Island or Package.
5.1.4. OLT Details Page
Click on the from the list to open the OLT device detail’s page. The details page opens in a new tab.
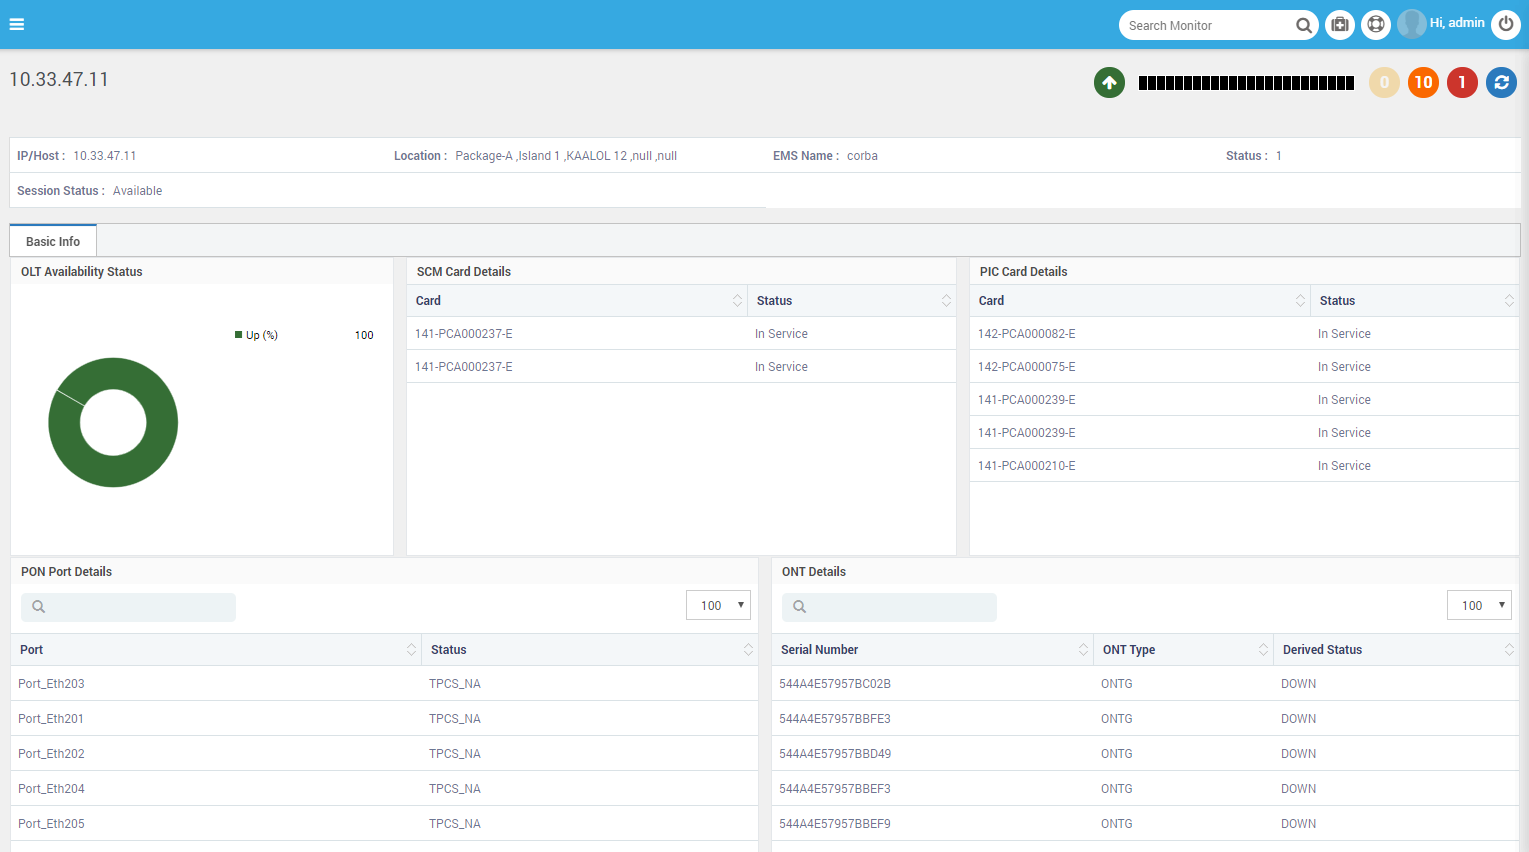
OLT Details Page
5.1.5. Health Status
The header shows the health status of the OLT device hourly and in run time. The green arrow on left shows the availability of the monitor i.e. Up, Down or Unknown. The hourly health is in the rectangle boxes. The color boxes with number shows the number of faults triggered in last sync.
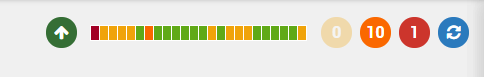
OLT Health Status
You can see the list of faults by clicking on the colored circle with example. See figure for example.
To sync the OLT monitor, click on .
5.1.6. Demographic Details
Some high level demographic details (that do not generally change on sync) are visible as a section. See figure for example.

Demographic Details
- IP/HOST: The IP address or host name of the device.
- Location: Location of the device.
- EMS Name: Name of the EMS connected with device and from which MOM is getting the data.
- Status: Status of the last sync.
- Session Status: Session status of the device.
5.1.7. OLT Availability Status
Shows the availability status of the ONT device. The widget shows the live availability i.e. from the last poll. (Polling time is configured in Admin > EMS Discovery).
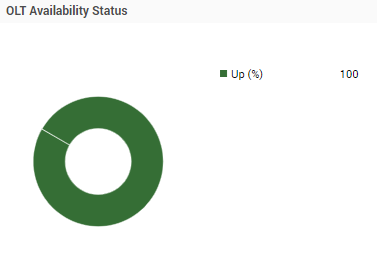
OLT Availability Status