6. Faults
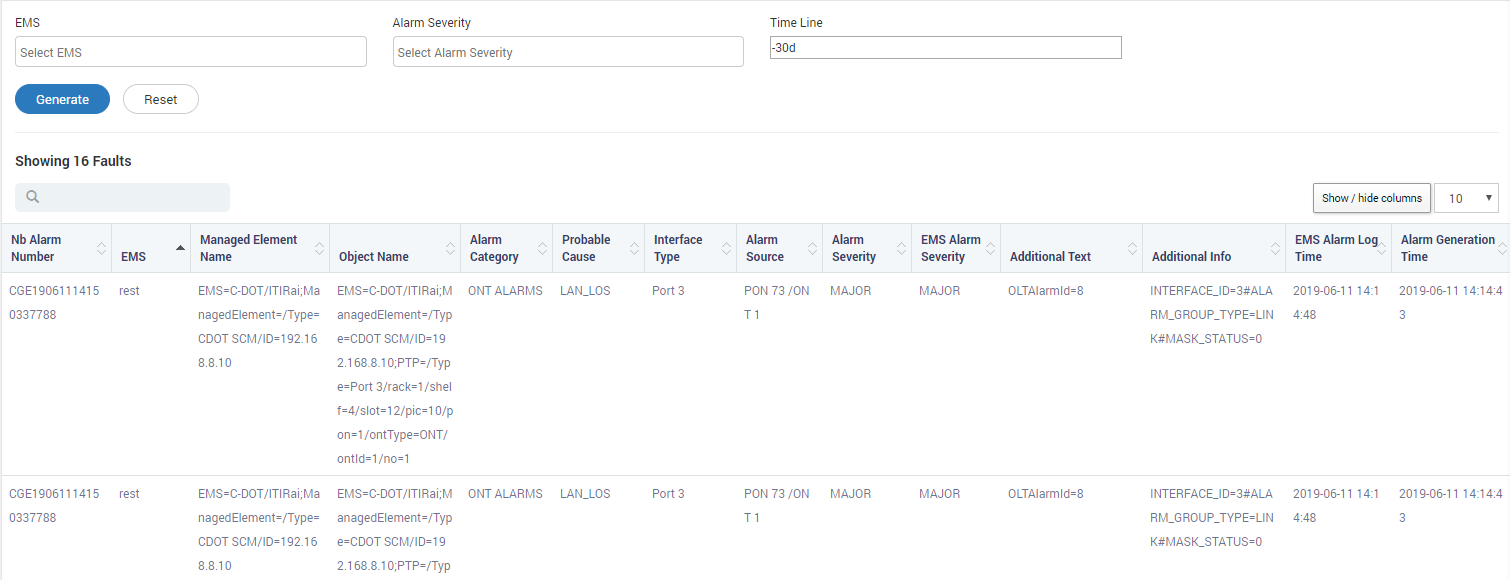
Faults menu shows the list of all the faults of the devices in the inventory. The filters and the timeline shows the desired output.

Faults List
6.1. Filters
6.1.1. EMS
Select the EMS from the drop-down for which you want to see the results. Click on the ‘Generate’ button to filter the results.

Select EMS Name
6.1.2. Alarm Severity
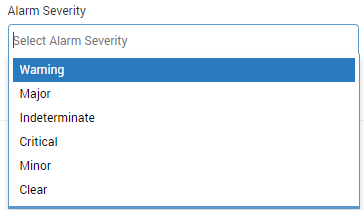
Select the alarm severity from the drop-down. The available alarm severity are:
- Warning
- Major
- Intermediate
- Critical
- Minor
- Clear

Alarm Severity
6.1.3. Time Line
Select the timeline for which you want to see the results. For example when you select ‘-30d’, all the faults for last 30 days (Today - 30 days) will appear in the result.

Time Line of Faults
6.2. Fault List
The list shows all the faults from the inventory devices. The list shows the desired output based on the filters applied.

Fault List
| Field | Description |
| Alert Number | (Unique) alarm number |
| NB Alarm Number | North bound alarm number |
| EMS | Name of the EMS affected by the fault |
| Managed Element Name | Standard naming convention to identify the vendor, OLT and ONT |
| Object Name | Standard naming convention to identify the port no./card no. |
| Alarm Category | Category of the alarm is provided by the EMS |
| Probable Cause | Name of the alarm provided by the EMS |
| Interface Type | Name of the port if alarm is generated on it |
| Alarm Source | Native probable cause of the alarm |
| Alarm Severity | Alarm severity provided by ONT/OLT |
| EMS Alarm Severity | Severity assigned by the EMS |
| Additional Text | Summary of the fault |
| Additional Info | Specific details related to the fault |
| EMS Alarm Log Time | Time on which the alarm is registered in system |
| Alarm Generation Time | Time on which alarm is generated |