2.3. Problem List View
The Problem List View is the central hub for Technicians to track and manage all Problems in the tool.
Log in to Motadata from the Technician Portal.
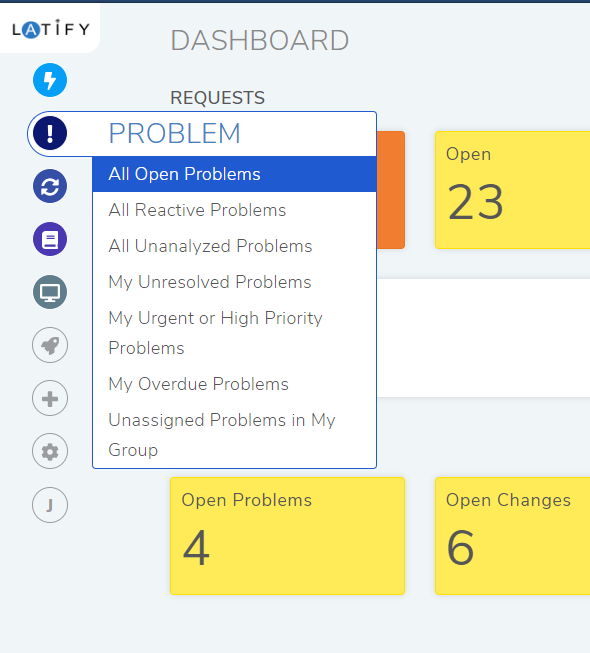
Click on Problem (A Navigation tab), or you can hover your mouse over Problem; you see a popup menu. Click on All Open Problems to see the list of all the available Problems in the product. The Problem List View opens.
List view
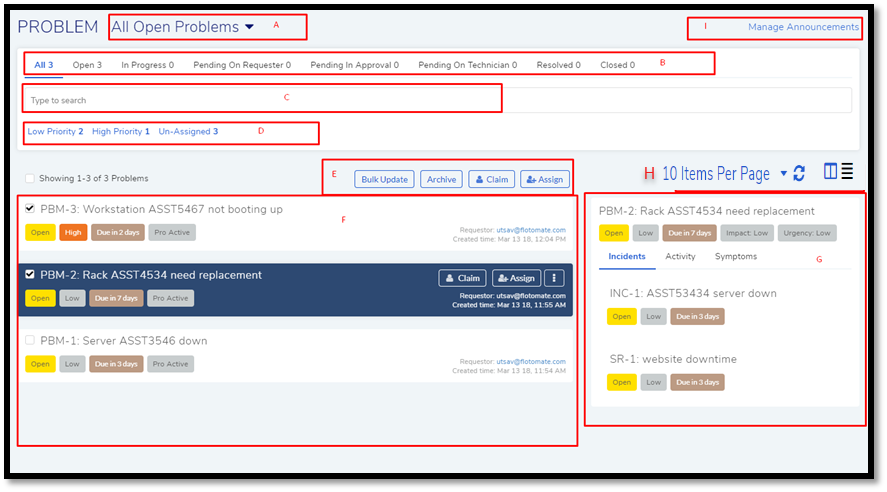
Please refer pmf-5 for the below descriptions:
Section A, B, C, & D houses the search options.
Section-E houses the following options:
Archive
Claim and Assign
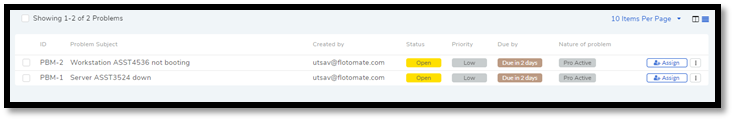
Section-F is the list area listing all the Problems with the following information:
Classifiers (Status, Priority, Due Date, & Nature of Problem)
Assignee information or Claim and Assign buttons. Next to them is the Action Menu having the following options:
Open In New Window
Requester info and Create time of the Problem.
Section-G is the Glance pane of a Problem that shows you some classifiers and the following tabs:
Incidents: Shows you the related Requests to the Problem.
Activities: Shows you the Audit Trail.
Symptoms: Shows you the inputted symptoms by a Technician.
Section-H gives you the option to set the number of Problems visible per page; the highest is 100 per page.
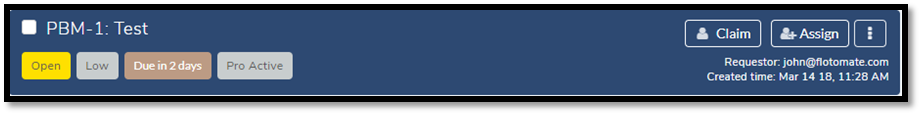
You can toggle between Table view-mode and Grid view-mode for the list area.
In Grid view-mode, the listings are more descriptive and explicit compared to Table view-mode. You can view additional information in the Glance pane of a Problem.
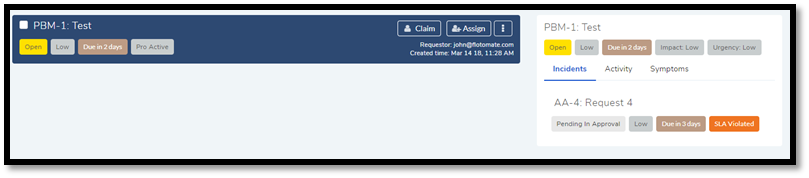
Table view-mode is minimalistic which shows minimum information. The focus is to give you the critical information.
You can select/unselect the columns you want to see using the icon.
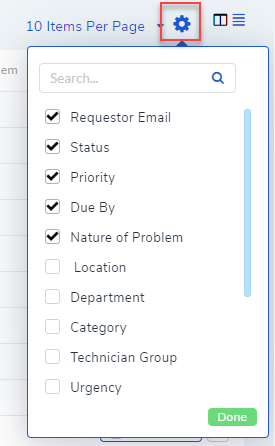
Select/Unselect Columns
Section-I is the Manage Announcements option.