11.1. Dashboard
11.1.1. Types of Graphs
The NCM dashboard shows the insights of backup operations of current date (starting from 12:00:00 AM). The screen has 4 sections with info-graphics of:
Recent Backups: Shows the total backups taken for a device type in the given time frame.
Device Distribution of Backups: Shows the pie chart with percentage of each device type in backups.
Trend of Failures for Backups: Shows the count of backup at every occurrence.
Showing Failed Backups: Shows the list of all the backups that failed.
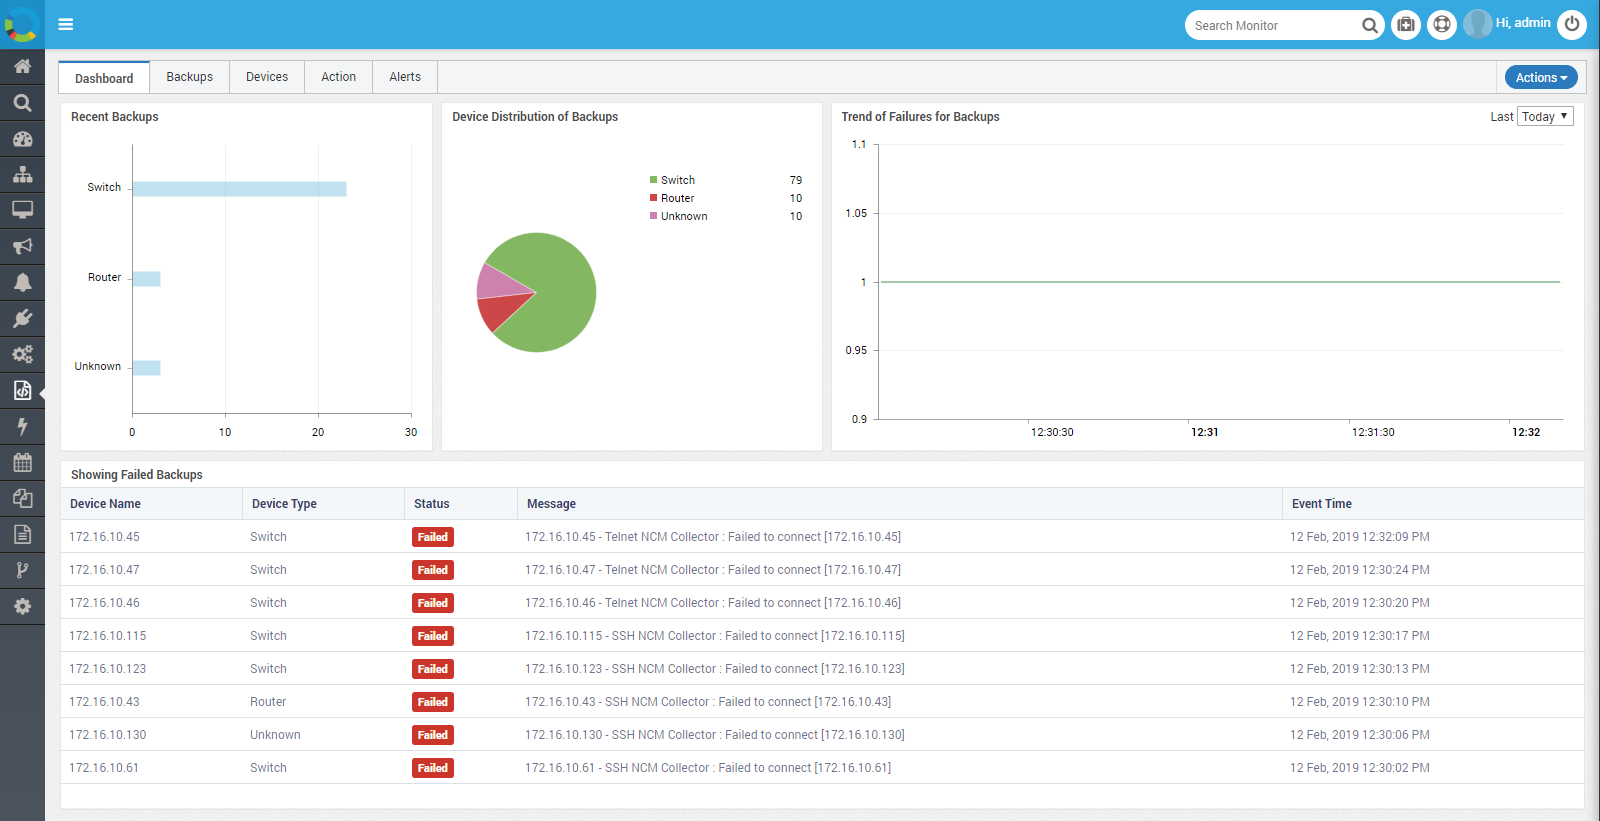
NCM Dashboard
You can download the graph as: PNG, JPG or CSV.
Recent Backups
Y-Axis: Type of the device.
X-Axis: Number of the backups.
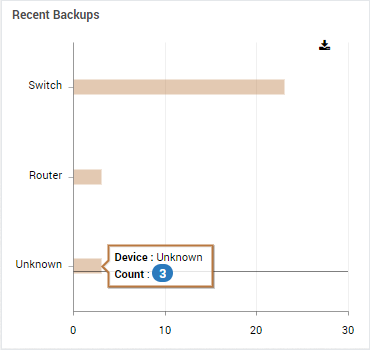
Recent Backups
Device Distribution of Backups
Count: Percentage of device type for which backup is taken. It ignores decimal places.
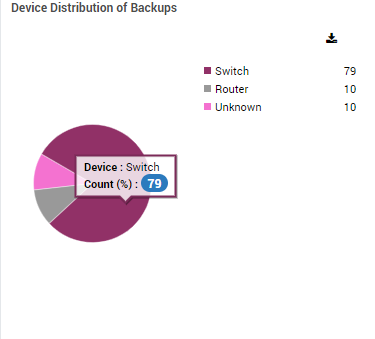
Device Distribution of Backups Pie Chart
You can download the graph as: PNG, JPG or CSV.
Trend of Failures for Backups
Y-Axis: Count of the backups.
X-Axis: Time frame of the backups.
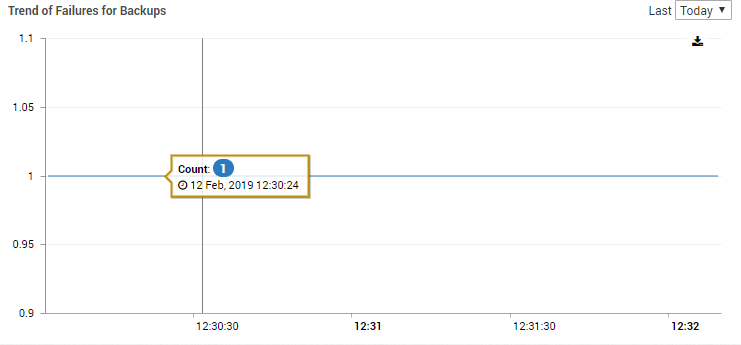
Trend of Failures for Backups
You can download the graph as: PNG, JPG or CSV. For granular analysis, change the time range. Available time ranges are: Today (12:00 AM-PM), 24 hours, 12 hours, 6 hours, 1 hours and 5 min.
Showing Failed Backups
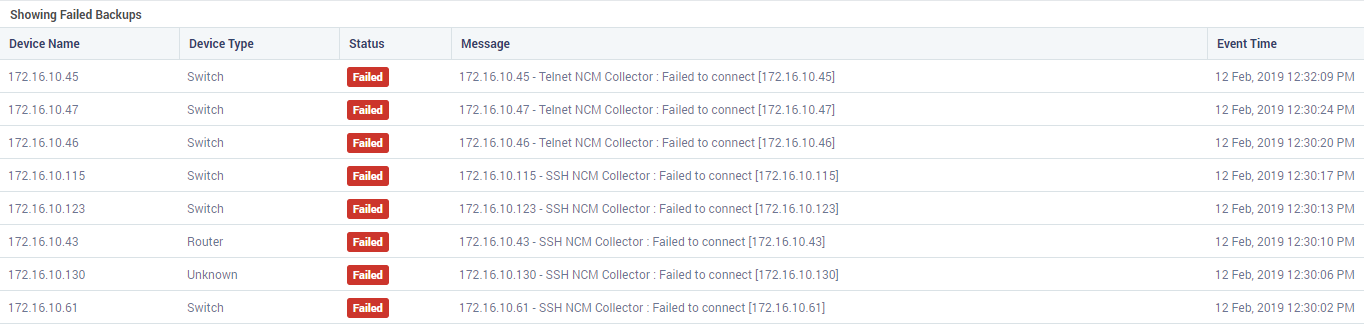
Showing Failed Backups Chart
Device Name |
Name of the SNMP device. If you didn’t set a name, IP/host name is displayed. |
Device Type |
Type of the SNMP device. |
Status |
Currently only Failed status is visible. In future we’ll upgrade the chart. |
Message |
Possible reason of the failure. |
Event Time |
Time of the backup event that failed. |
11.1.2. Graph Actions
Following actions are available for the graphs:
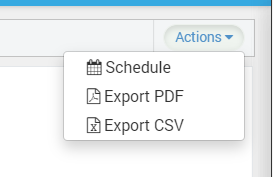
Graph Options
Schedule
Export PDF
Export CSV
11.1.2.1. Schedule
Click on the Schedule to send the NCM dashboard as a report as an email attachment.
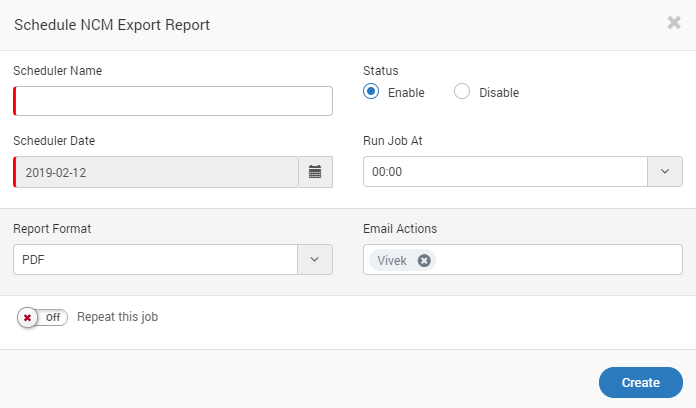
Schedule NCM Report
See Schedulers for details about scheduling jobs.
11.1.2.2. Export PDF
Download the report in PDF format.
11.1.2.3. Export CSV
Download the report in CSV format.