5.2. Tag View
The view shows all the tags you created in Motadata. We offer 3 views for this.
Radial View
Tree View
Hierarchy View
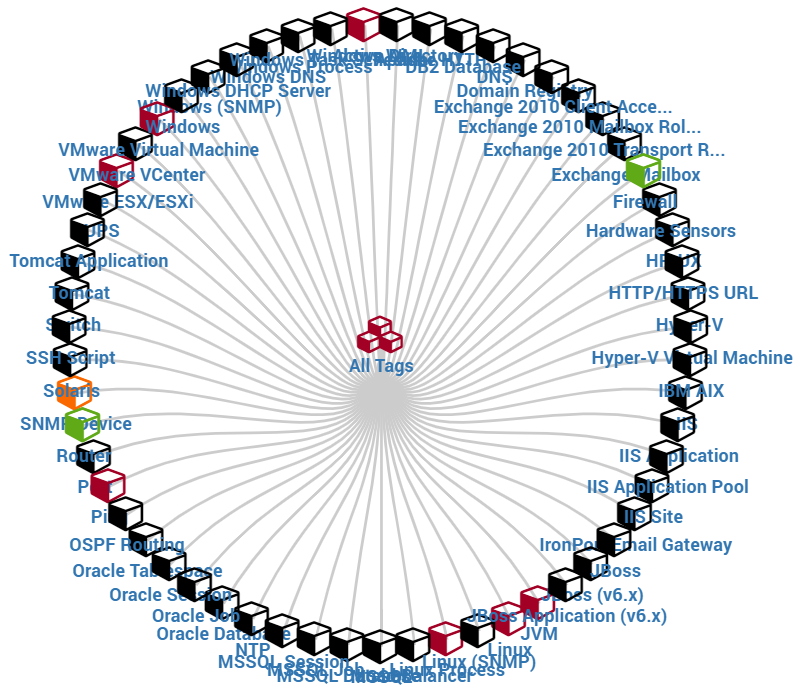
Radial View
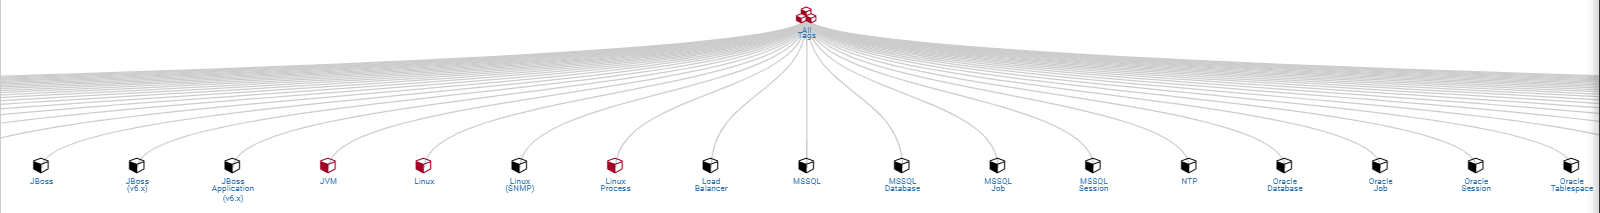
Hierarchy View
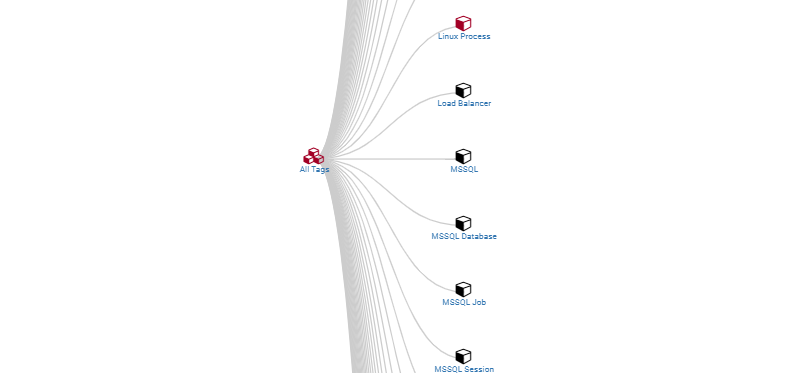
Tree View
Click on the tag icon and you’ll see the summary and health of the tag on top right corner.
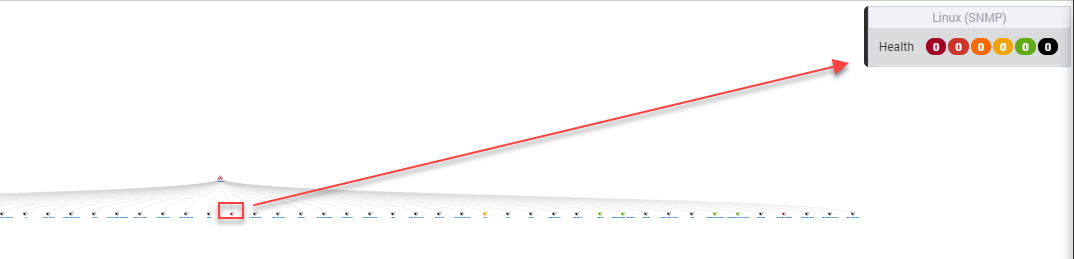
Tag Health and Summary
Click on the tag name and see the details of monitors under it.
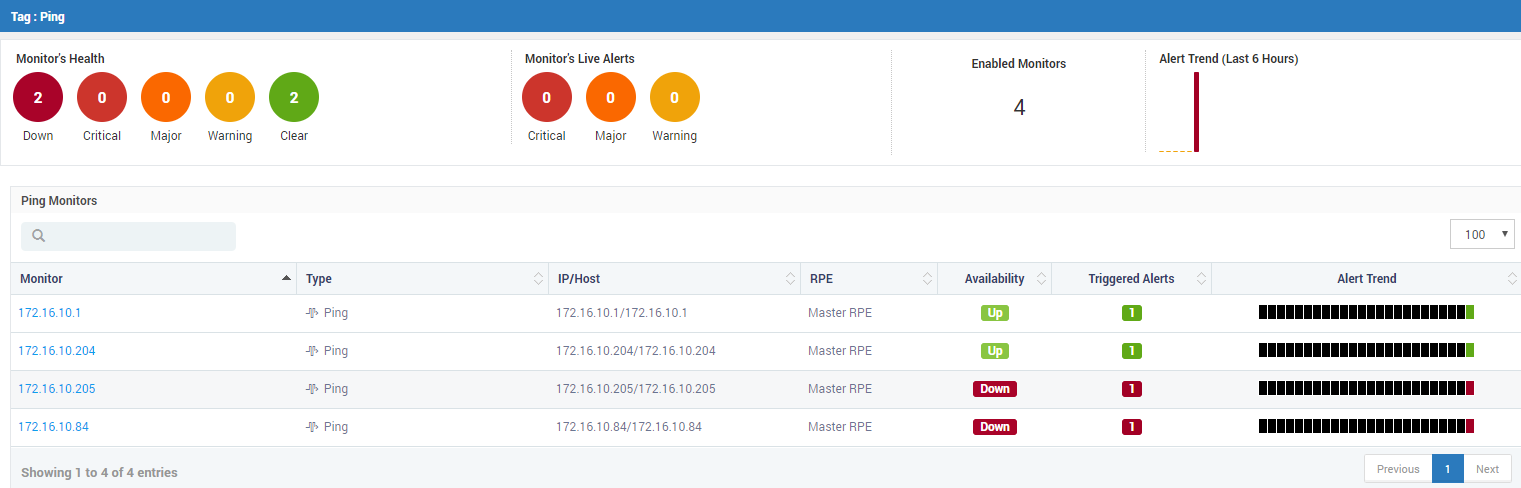
Click on Health and you’ll see IP Addresses under it
Under Monitor Health section, click on the number in health status and see the IP addresses in that state.
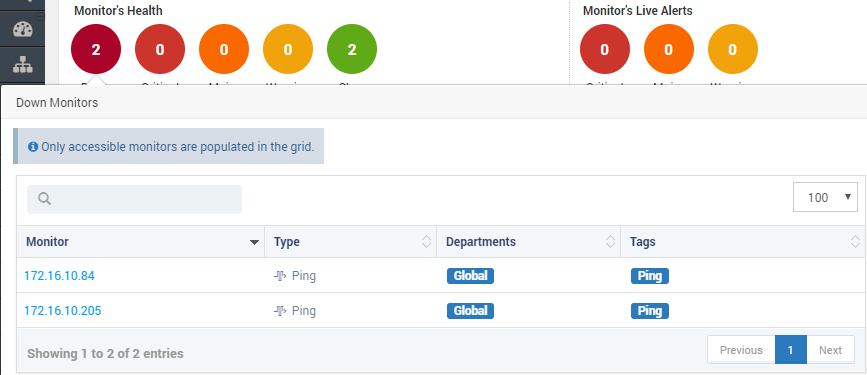
Monitors with Health in Down State
In Alert Trend, you will see the graph for number of alerts fired (on hourly basis) and color code for status of monitor when alert was fired.
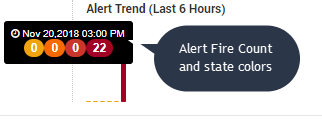
Alert Trend - Showing Alert Count and Status Colors