2.2. Overview
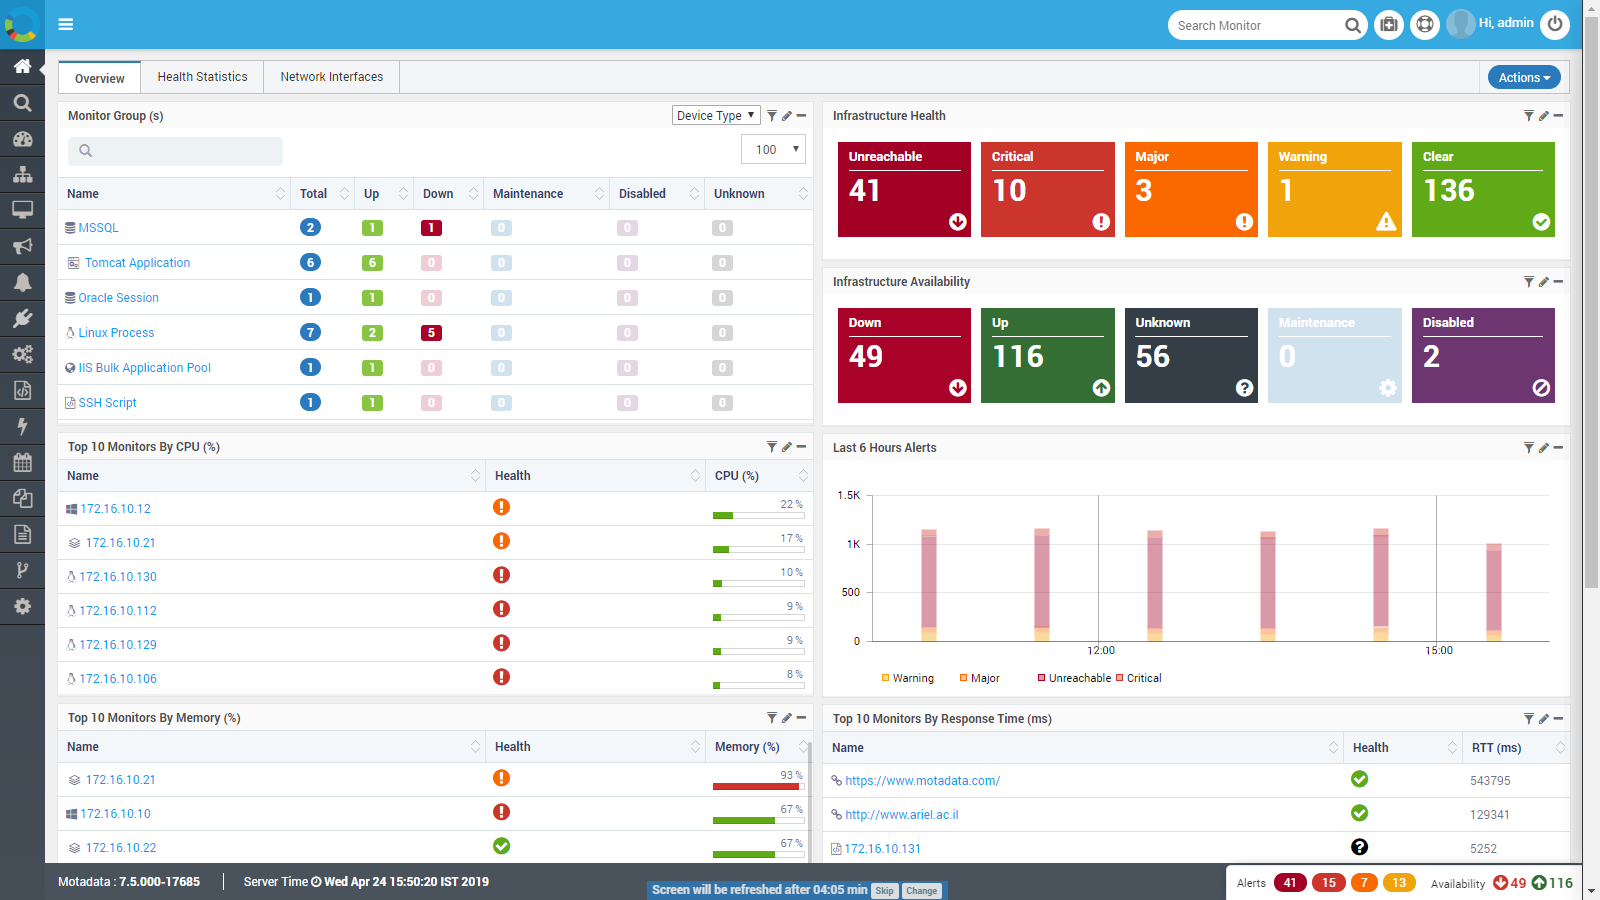
Overview tab shows you the quick summary of monitors. The monitor’s information is filtered using different classifiers and displayed as widgets. You can go to each widget and see the detailed information. The overview tab on the Homepage has following widgets:
Monitor Groups: The groups are created based on the type of monitors.
Infrastructure Health: The widget shows the health of monitors in terms of severities.
Infrastructure Availability: The widget shows the counts of monitors according to their availabilities.
Top 10 Monitors by CPU (%): The widget shows the list of 10 top monitors based on the CPU consumption.
Last 6 Hours Alerts: The graph in widget shows the no. of alerts for per hour for last 6 hours.
Top 10 Monitors by Memory (%): The widget shows the list of top 10 monitors based on the memory consumption.
Top 10 Monitors by Response Time (ms): The widget shows the list of top 10 monitors based on the maximum response time.
Top 10 Monitors by Disk ($): The widget shows the list of top 10 monitors by HDD consumption.
Recent Monitor Alerts: Shows the monitor alerts for last 1 hour.

Home Page