ObserveOps Infinity Version 10.0.0
Release Date: August 17, 2026
What's New?
Observability Pipeline Introduced
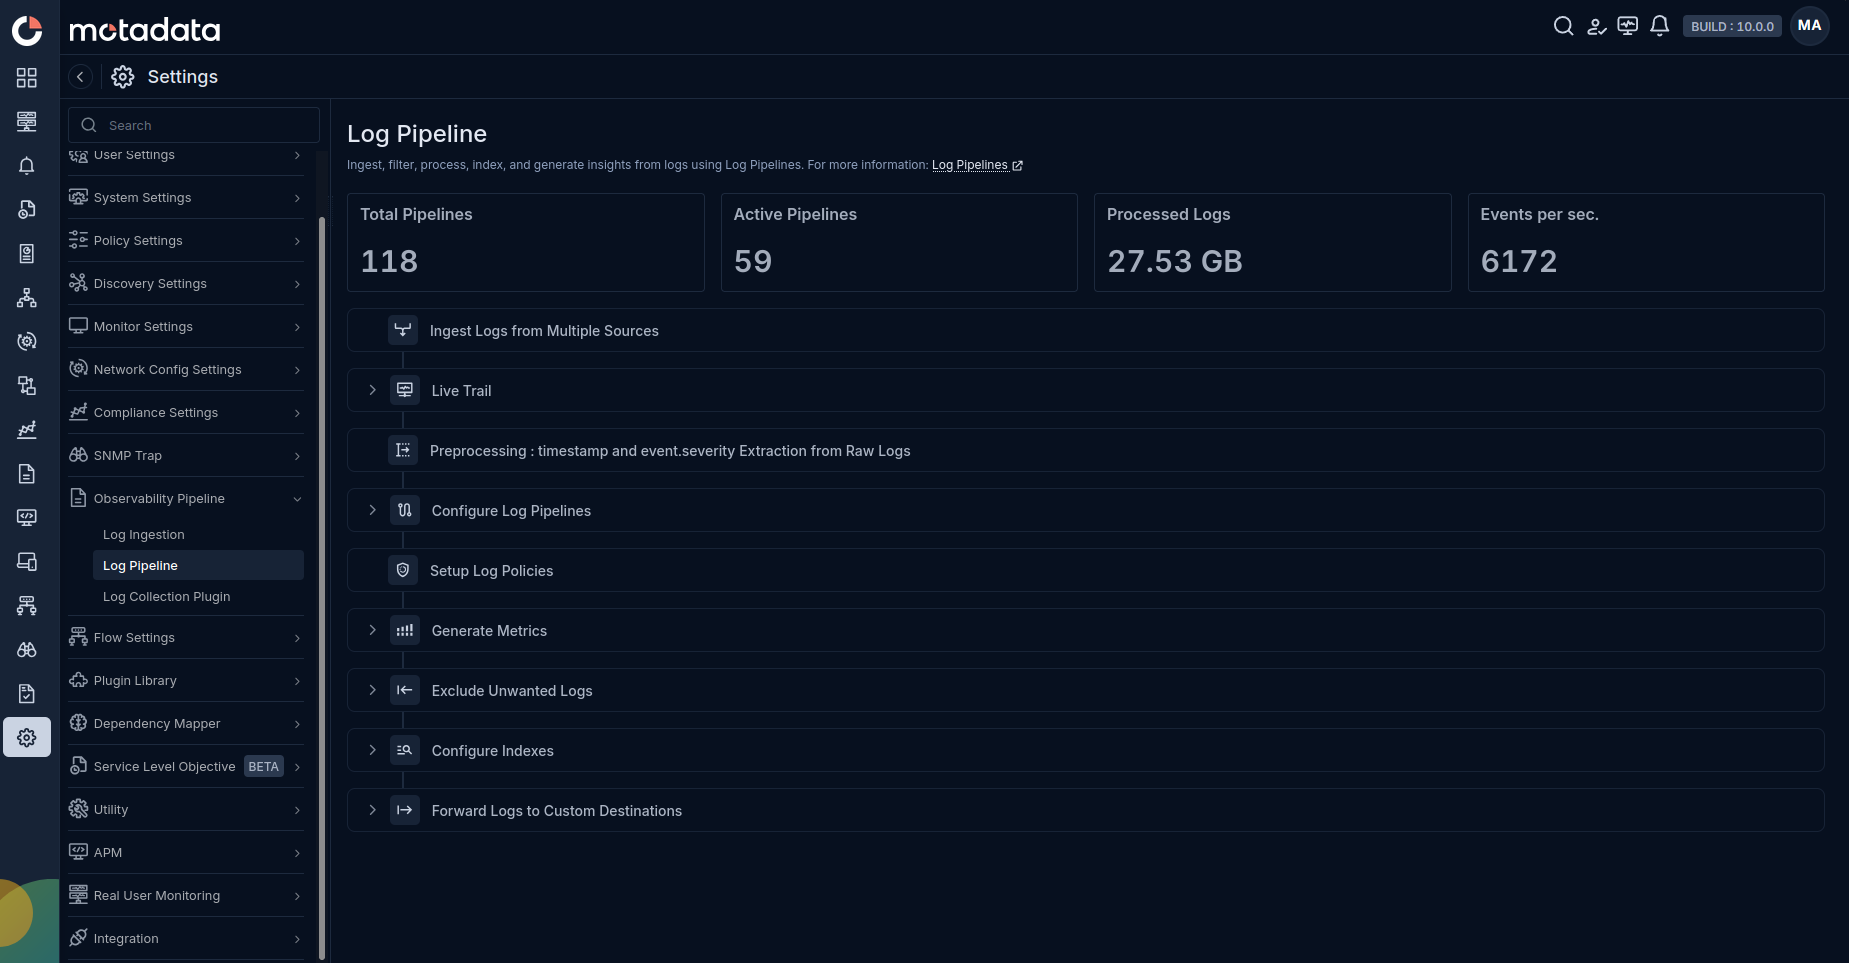
With this release, ObserveOps introduces the Observability Pipeline, a centralized processing engine for all log management available under Settings > Observability Pipeline. Every log that enters the system is seamlessly ingested, parsed, enriched, filtered, and routed to the right retention bucket before it reaches storage. The pipeline covers the full log lifecycle through various configurable stages: Log Ingestion, Live Trail, Configure Log Pipelines, Generate Metrics, Exclude Unwanted Logs, Configure Indexes, and Forward Logs.
Topology Module Custom Views Introduced
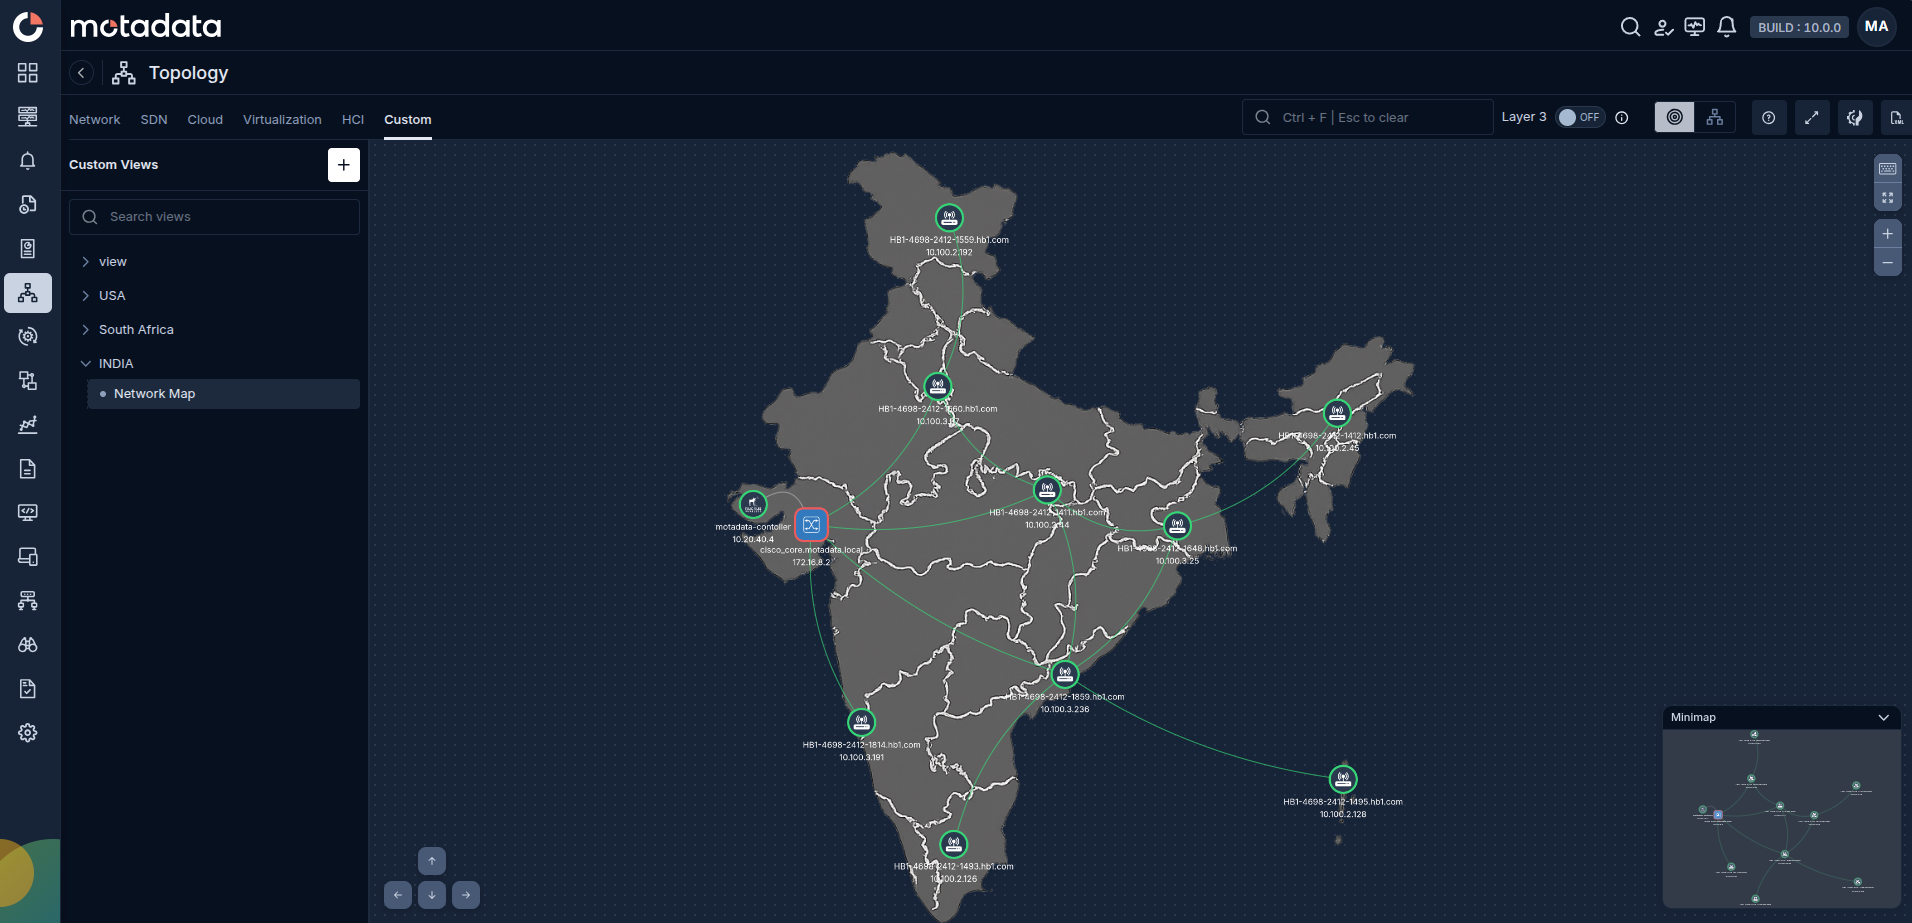
Users can now create named Custom Views by selecting specific nodes, arranging them manually on the canvas, and saving the layout. Saved layouts persist between sessions with live status updates, so the nodes always reflect their current health state. Users can create multiple custom views and delete views they no longer need.
Microsoft Graph API Email Delivery Added
With this release, ObserveOps adds Microsoft Graph API as a supported email delivery method alongside the existing SMTP options. This allows organizations that have disabled SMTP AUTH on Exchange Online to continue receiving alert notifications and scheduled reports without relying on SMTP. Configuration requires an Azure app registration with the Mail.Send application permission and admin consent. Switching to Microsoft Graph does not require changes to existing alert policies, notification templates, or recipient lists.
AWS Bedrock, SageMaker, Firehose, and Eight More Cloud Services Added
With this release, ObserveOps adds monitoring support for eleven new AWS cloud services: Amazon Bedrock, Amazon Kinesis Data Firehose, Amazon SageMaker, Amazon MQ, AWS WAF, AWS ACM, AWS KMS, AWS CloudTrail, Amazon Cognito User Pool, Amazon Athena, and AWS Config. All eleven services are discovered through the existing AWS credential profile using CloudWatch metrics, and their data is available in Metric Analysis and can be used to create alert policies.
ClickHouse Database Monitoring Added
With this release, ObserveOps adds dedicated monitoring support for ClickHouse. Key metrics include query throughput, failed queries, query latency percentiles, replication queue size, replication errors, merge operations, insert rates, memory usage, disk utilization, active connections, and ClickHouse Keeper health when Keeper is in use.
Alert Detail Page Redesigned with AI-Native Experience
With this release, the Alert Detail page has been completely redesigned with a modern, AI-native layout that improves alert investigation and incident response workflows. The revamped page delivers improved information architecture, contextual trend analysis, and streamlined operational actions, with no changes to existing alert processing logic.
HPE 3PAR, Alletra, and Primera Enclosure Health Plugin Added
With this release, an out-of-the-box custom metric plugin is available in the Plugin Library for collecting enclosure-level hardware health from HPE 3PAR, HPE Alletra, and HPE Primera storage systems. The plugin connects and collects status for power supply units, fans, drive cages, temperature sensors, I/O modules, controller nodes, and battery modules. You can assign the plugin to existing HPE storage monitors to add physical hardware visibility alongside the storage performance metrics already collected.
Dell Compellent Storage Monitoring Added
With this release, ObserveOps adds monitoring support for Dell Compellent storage systems. Dell Compellent is discoverable through the Storage Discovery Profile by selecting Dell as the vendor and Compellent as the device model. Collected metrics include system information, volume capacity and IOPS, controller CPU and memory usage, disk health, and port status. All metrics are available in Metric Analysis.
Dell Isilon NL410 Storage Monitoring Added
With this release, ObserveOps adds monitoring support for Dell Isilon NL410 scale-out NAS systems. Dell Isilon is discoverable through the Storage Discovery Profile by selecting Dell as the vendor and Isilon as the device model. Collected metrics cover cluster health, per-node CPU and memory, NFS and SMB protocol throughput and latency, storage pool capacity, and SyncIQ replication status.
HPE Alletra Storage Monitoring Added
With this release, ObserveOps adds monitoring support for HPE Alletra all-NVMe storage systems. HPE Alletra is discoverable through the Storage Discovery Profile by selecting HPE as the vendor and Alletra as the device model. Collected metrics include volume capacity and performance, controller CPU and cache hit ratio, NVMe drive endurance, and replication status. All metrics are available in Metric Analysis.
UPS Device Monitoring Added
With this release, ObserveOps adds monitoring support for UPS (Uninterruptible Power Supply) devices via SNMP. UPS devices are discoverable through the Network Discovery Profile using SNMP V1, V2c, or V3 credentials. Collected metrics include battery charge level, remaining runtime, input and output voltage and frequency, output load percentage, and device status conditions such as on-battery and low-battery states. All metrics are available in Metric Analysis.
Extreme Wireless Controller Monitoring Added
With this release, ObserveOps adds monitoring support for Extreme Wireless controllers. Extreme Wireless is discoverable through the Wireless Discovery Profile using SNMP V1, V2c, or V3 credentials. Collected metrics include controller uptime, total AP count, connected client count, per-AP status and channel utilization, radio noise floor, and total transmit and receive throughput. All metrics are available in Metric Analysis.
Dell PowerVault Storage Monitoring Added
With this release, ObserveOps adds monitoring support for Dell PowerVault storage systems. Dell PowerVault is discoverable through the Storage Discovery Profile by selecting Dell as the vendor and PowerVault as the device model. Collected metrics include volume capacity and utilization, controller health, disk status, and port performance. All metrics are available in Metric Analysis.