14.7. Managing Dashlets
A Dashboard is like an empty canvas, and Dashlets are data blocks showing specific data. Multiple Dashlets together give contextual meaning to a Dashboard. There are n number of permutations that can be achieved using different kinds of Dashlets all showing different data.
We currently have three kinds of Dashlets:
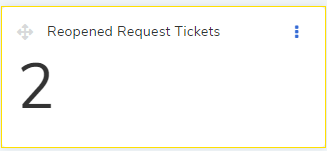
KPI: The abbreviation stands for Key Performance Indicator which is a counter of occurrences satisfying a preset condition. For example, there could be a KPI that shows the number of Request tickets having reopen count greater than 0.
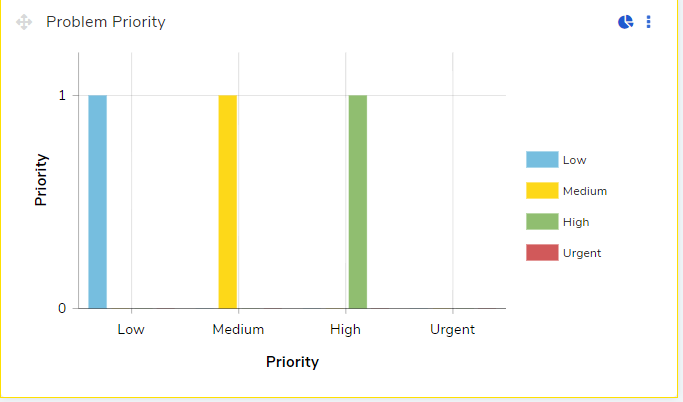
Widget: A widget shows data points graphically across x and y coordinates or as proportions. For example, count of Problem tickets can be shown across priorities using a bar chart.
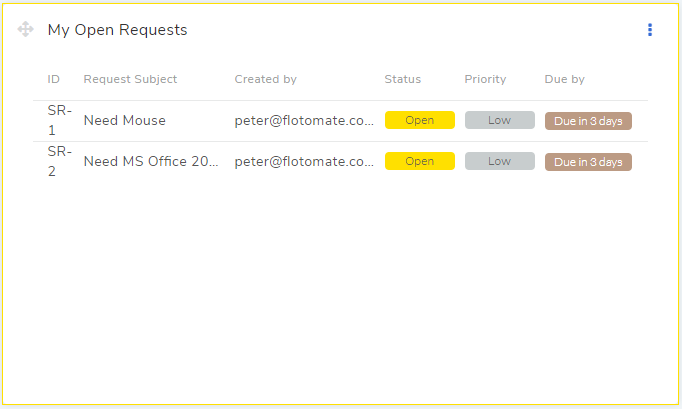
Shortcut: It is a predefined box that shows specific system data; for example, there is a Shortcut box called My Open Request that shows recent open Requests assigned to you.
A user having the necessary :ref:` Dashboard permissions <dashboard-permissions>` can perform the following operations with Dashlets:
View Dashlets, along with their parameters.
Create custom Dashlets (not possible with Shortcuts).
Edit existing Dashlets (not possible with Shortcuts).
Create duplicate of a Dashlet (not possible with Shortcuts).
Delete a custom Dashlet (not possible with Shortcuts and predefined Dashlets).
14.7.1. Creating a Custom Dashlet
If you have the necessary permissions, you can create n number of custom Dashlets (only KPIs and Widgets) apart from the predefined Dashlets.
14.7.1.1. Accessing the Dashlet panel
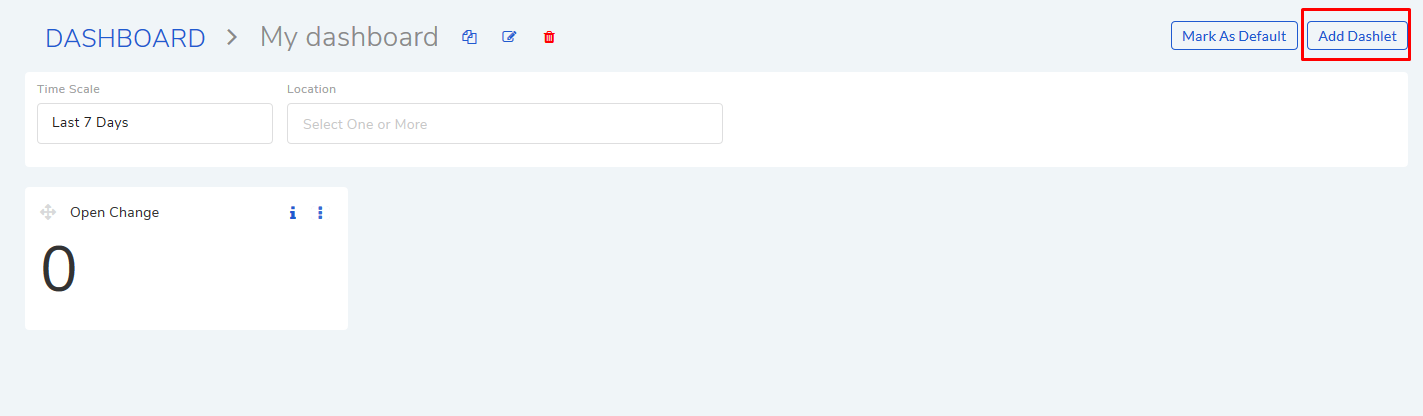
Go to the Dashboard List page.
Go inside a Dashboard (only a super user can open a predefined Dashlet).
Click on Add Dashlet situated in the top right corner.
14.7.1.2. Create a KPI
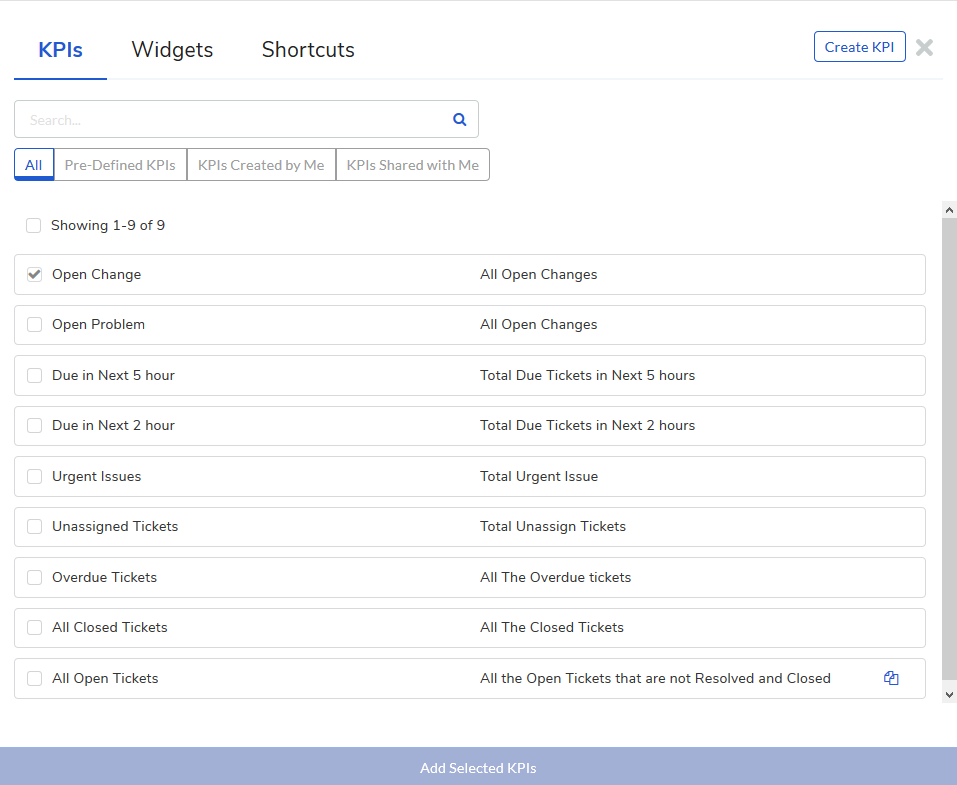
In the Dashlet panel, select the KPI tab and click on Create KPI.
A dialog box opens where you can provide the following inputs:
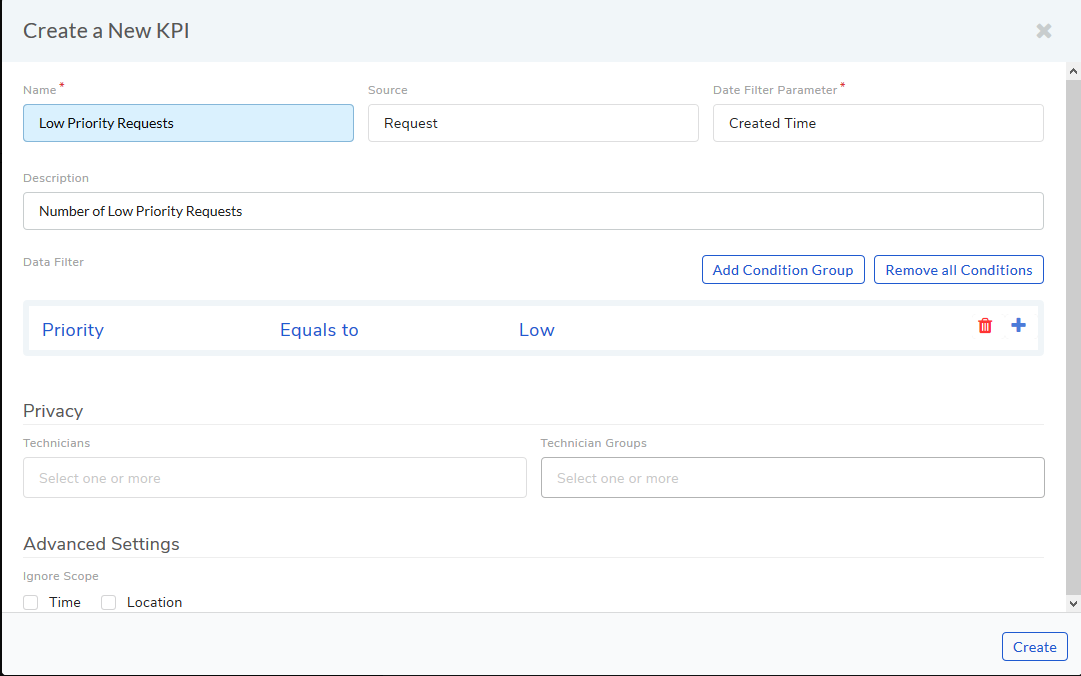
Name of KPI.
Name of the module of which the KPI belongs (either Request, Problem, Change or Asset).
Data Filter Parameter: It allows you to filter data using time. When filtering ticket and Asset data, one of the below mentioned type of time data is considered, depending on your module selection.
Created Time: This option is valid for all modules. A Dashboard has a time filter; using this option makes a KPI to show only those data points whose create time falls within the selected time period. For example, a KPI that shows the number of Assets added in a time period will consider the create time of each Asset.
Updated Time: This option is valid for all modules. Instead of Create Time, the system uses the Update Time in checking data.
Closed Time: This option is valid for only Request, Problem and Change. The closed time of a ticket/item is considered to check whether it falls within a specified period.
Selecting an Asset Type when Asset module is selected. Accordingly the parameter list will be updated.
Description of the KPI.
Data Filter: A KPI is a counter that shows the number of times a condition/set of conditions were satisfied. A condition is created using parameters. For example; Priority Equals to Low for Request module will show the count of Requests with Priority Low for a specific time period.
Multiple conditions can be clubbed together using AND and OR. See below for example:
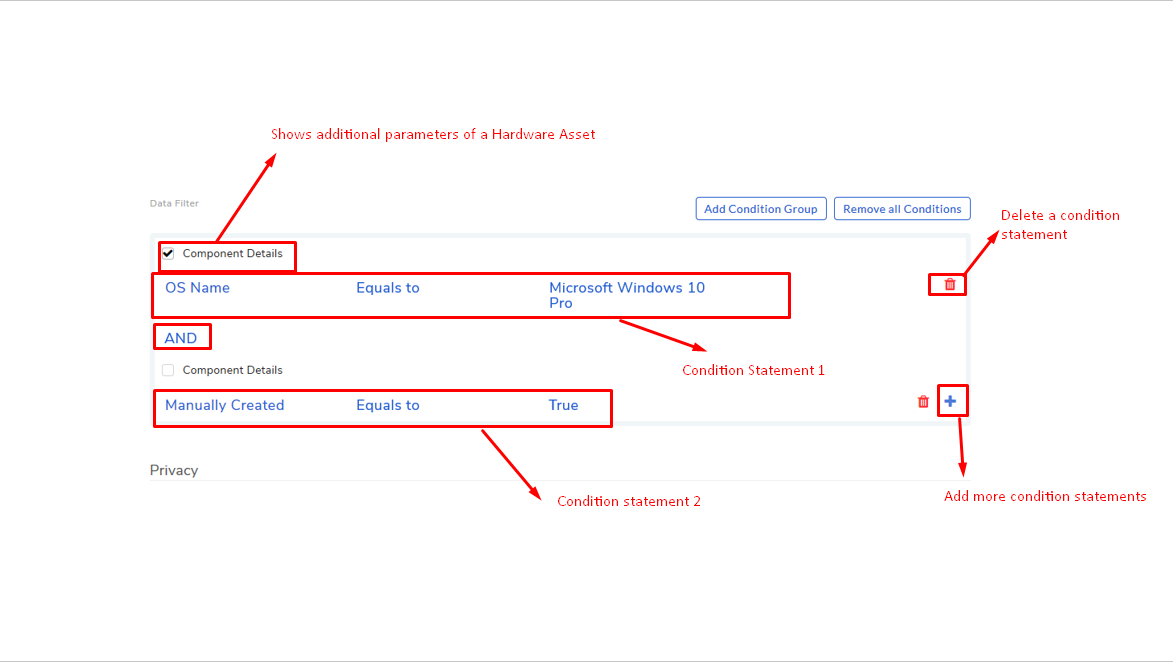
With the above conditions, the KPI will show all computers with the Windows OS that have been manually added.
We can also group the conditions and put a AND and OR between them. A condition group supports up to two conditions.
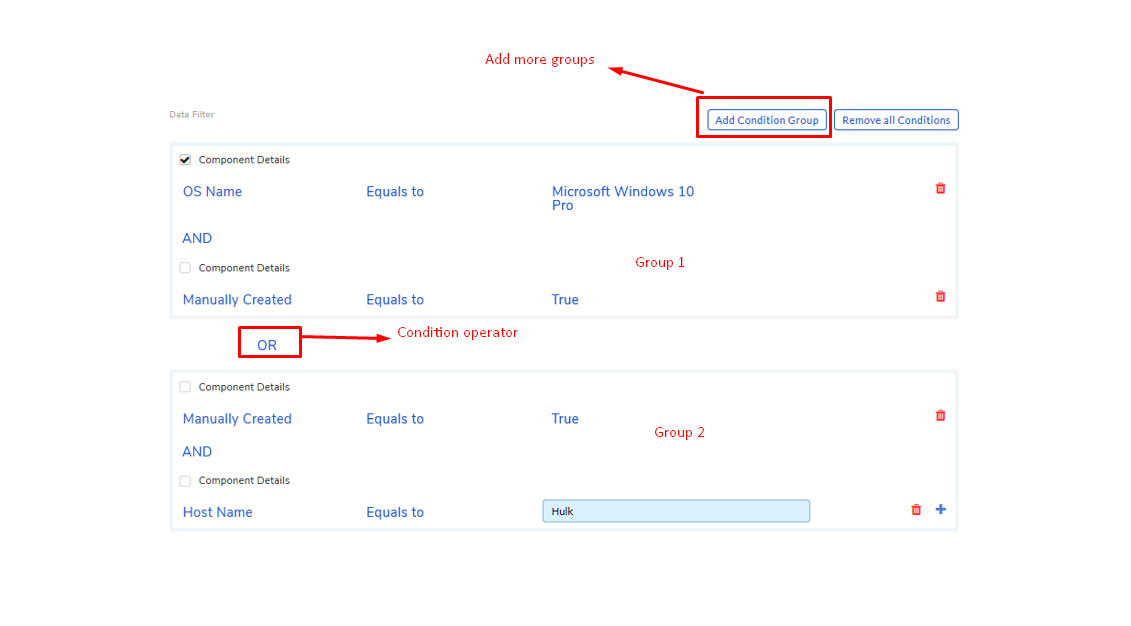
With the above conditions, the KPI will show all computers that have been manually added either with Windows OS or Hostname Hulk or both.
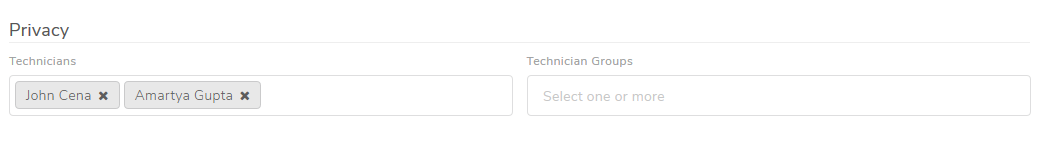
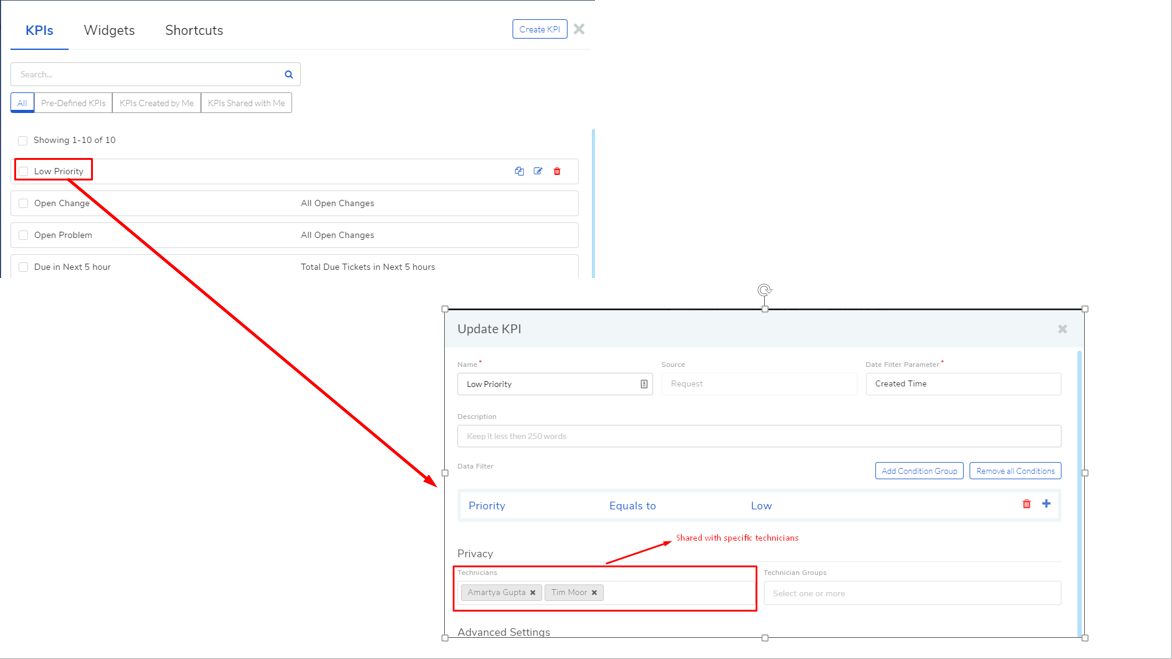
Privacy Settings: You can share the KPI with specific Technicians and Groups; they will able to view the KPI but not edit or delete it.
Advance Settings: By checking the Time and Location options, you can make the KPI ignore the Time and Location filters of a Dashboard.
When done, click on Create to add the KPI under the KPI tab.
14.7.1.3. Creating a Widget
In the Dashlet panel select the Widget tab.
Click on Create Widget in the top right corner.
A dialog box opens where you can provide the following inputs:
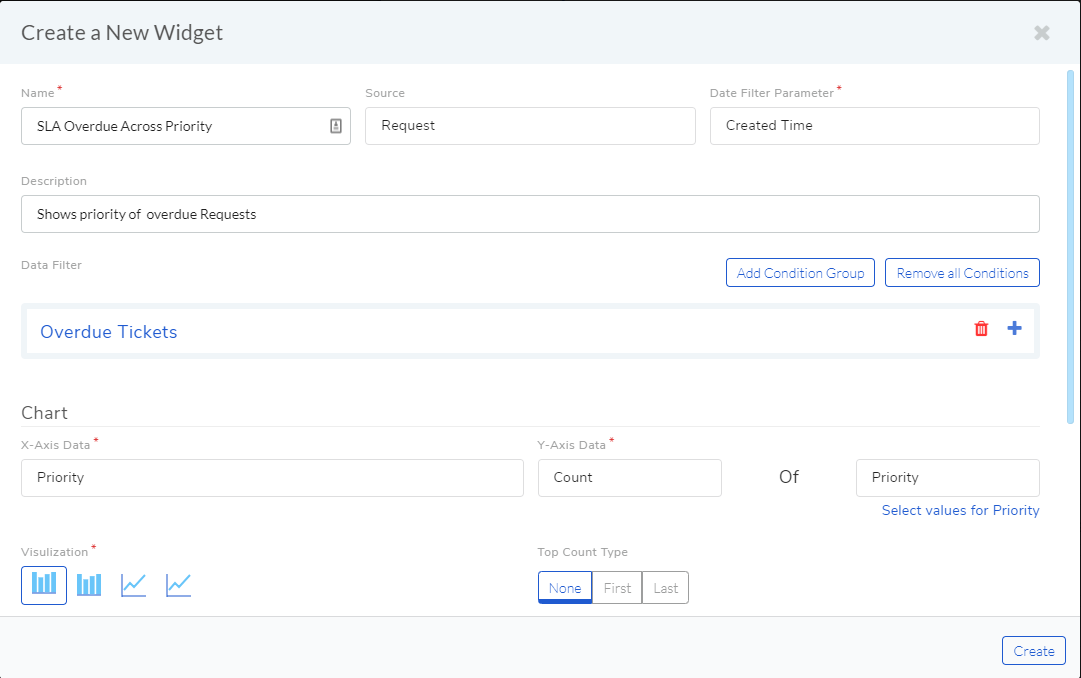
Name of the Widget.
Module name of which the widget will show data.
Data Filter Parameter: It allows you to filter data using time. When filtering ticket and Asset data, one of the below mentioned type of time data is considered, depending on your module selection.
Created Time: This option is valid for all modules. A Dashboard has a time filter; using this option makes a widget to show only those data points whose create time falls within the selected time period. For example, a widget that shows the number of Assets added in a time period will consider the create time of each Asset.
Updated Time: This option is valid for all modules. Instead of Create Time, the system uses the Update Time in checking data.
Closed Time: This option is valid for only Request, Problem and Change. The closed time of a ticket/item is considered to check whether it falls within a specified period.
Warranty Expiration Date: Warranty Expiration Date of an Hardware Asset (including all its children) is considered to check whether it falls within a specified period.
Acquisition Date: Acquisition Date of an Hardware Asset (including all its children) is considered to check whether it falls within a specified period.
Audit Date: Audit Date of an Hardware Asset (including all its children) is considered to check whether it falls within a specified period.
Description of the widget.
Data Filter: A widget graphically shows the count/average of data points categorically as a chart. Here what data to use you can decide using a condition or set of conditions (filters). A condition is created using parameters. For example; SLA Violation Equals to True for Request module will show tickets that have violated the SLA resolution time for a specific time period.
Filters can be made using multiple conditions all connected by logical operators: AND and OR. Conditions can be grouped together as well.
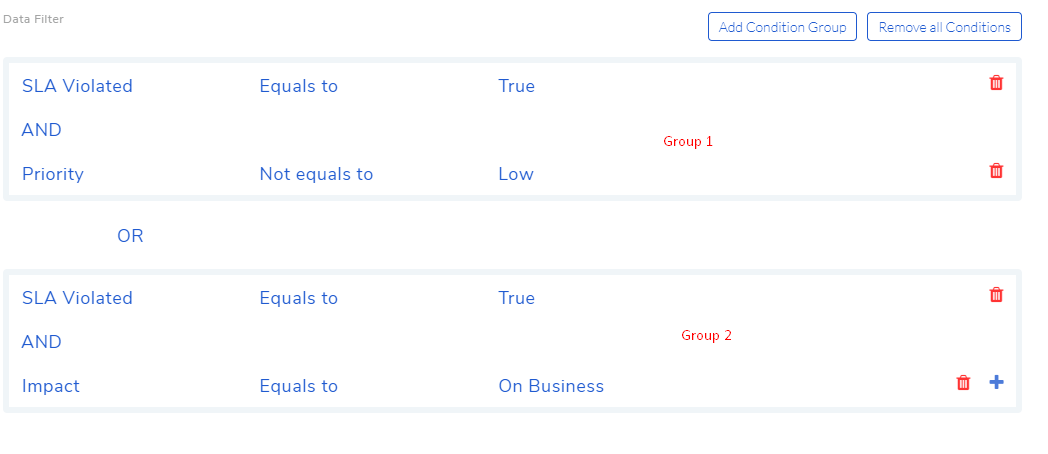
With the above conditions, the widget will filter all Request tickets with SLA violation either with Priority anything other than low or Impact on Department or both.
Charting Options: Here you decide how to represent the filtered data.
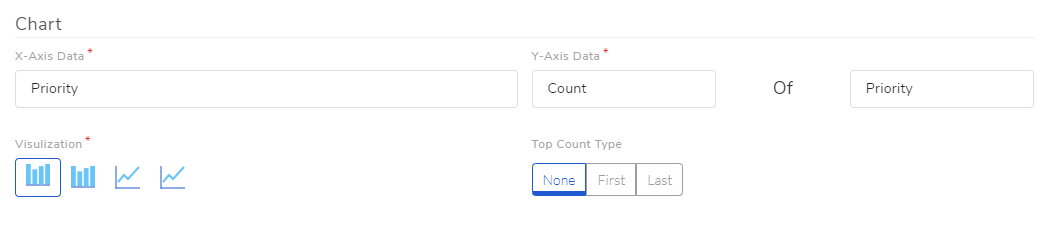
The filter data will have parameters, which any one you can choose to show on the X axis. The above diagram, The Priority parameter has been selected to be represented on x axis.
The y axis holds functions; here (
das-21.2) we use the Count function to count Request tickets across priorities. We disable the value Low for the parameter Priority.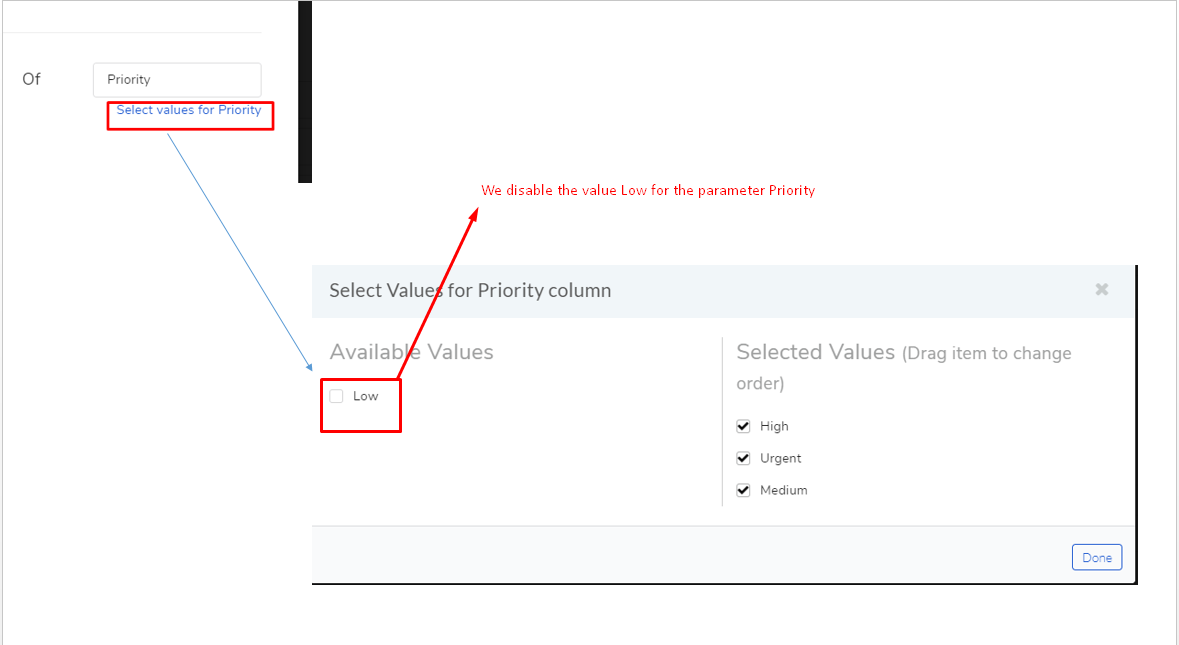
We select a Chart type from bar (column) chart, line chart and pie chart.
We can select a Count Type from:
First: X axis will be sorted (based on count) in descending order.
Last: X axis will be sorted (based on count) in ascending order.
Learn more about Privacy and Advanced Settings.
When done, click on Create to add the Widget under the Widget tab.
14.7.2. Searching and Filtering Dashlets
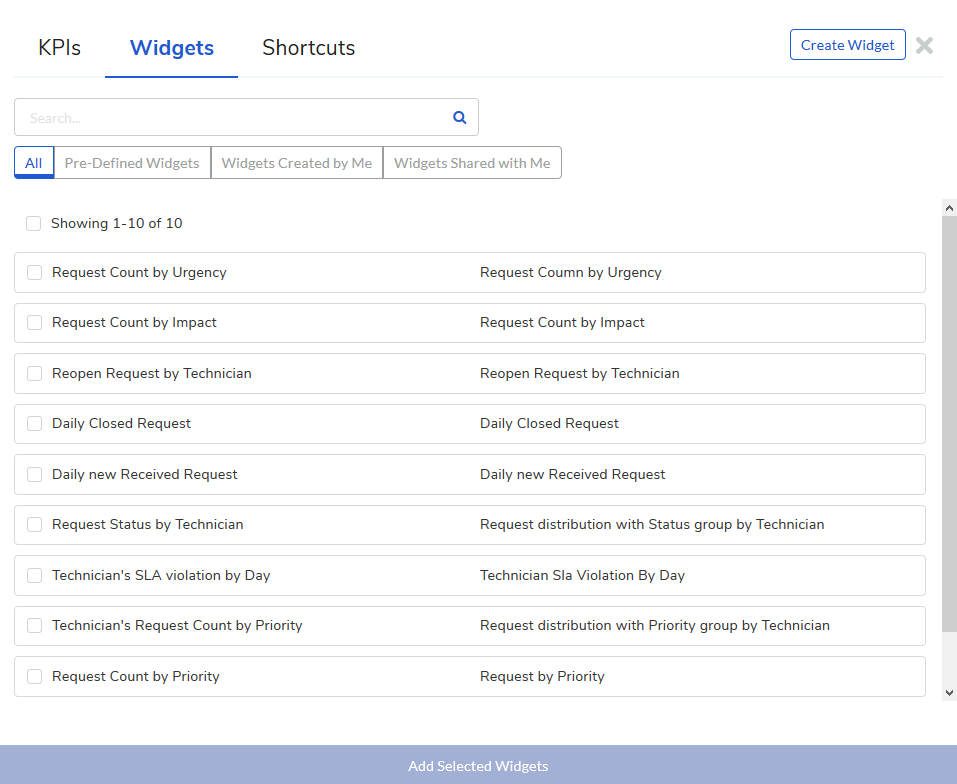
In the Dashlet panel, a user can search and filter Dashlets across KPIs and Widgets; the search features are not available for Shortcuts. There are two ways you can search for a Dashlet:
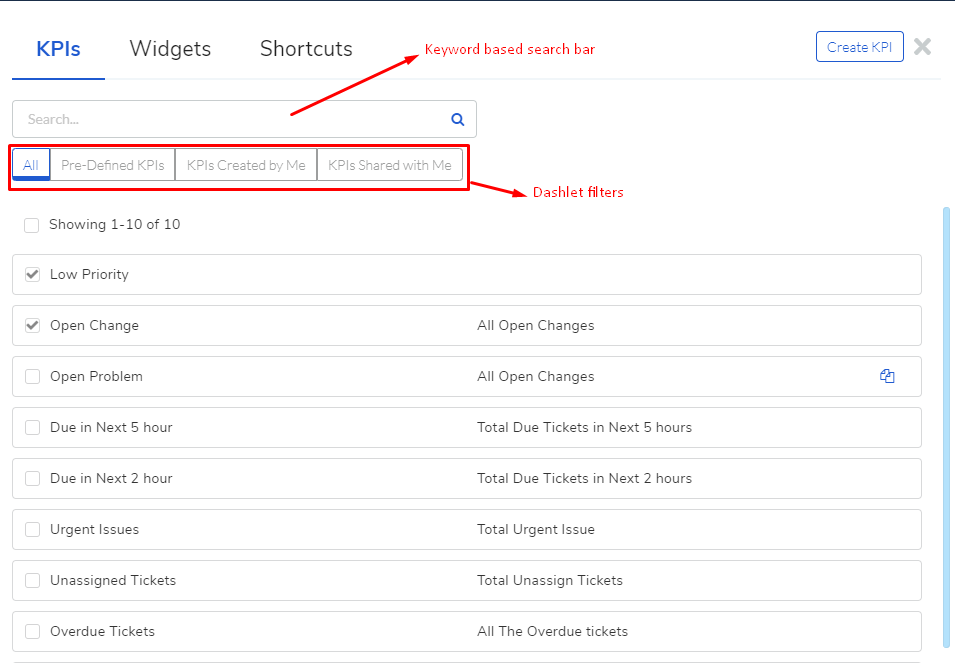
Keyword based search box.
Filters: You get three filters for KPIs and Widgets.
All Predefined KPIs/Widgets.
All KPIs/Widgets created by you.
All KPIs/Widgets shared with you.
14.7.3. Viewing and Editing Dashlets
Note
Only the super user can edit predefined Dashlets (barring Shortcuts).
All user with the Dashboard rights can view the definition of a KPI and Widget. But only a owner of a Dashlet (KPI or Widget) can edit its definition.
Go to the Dashboard List page and open a Dashboard.
You can view the definition of a KPI and Widget.
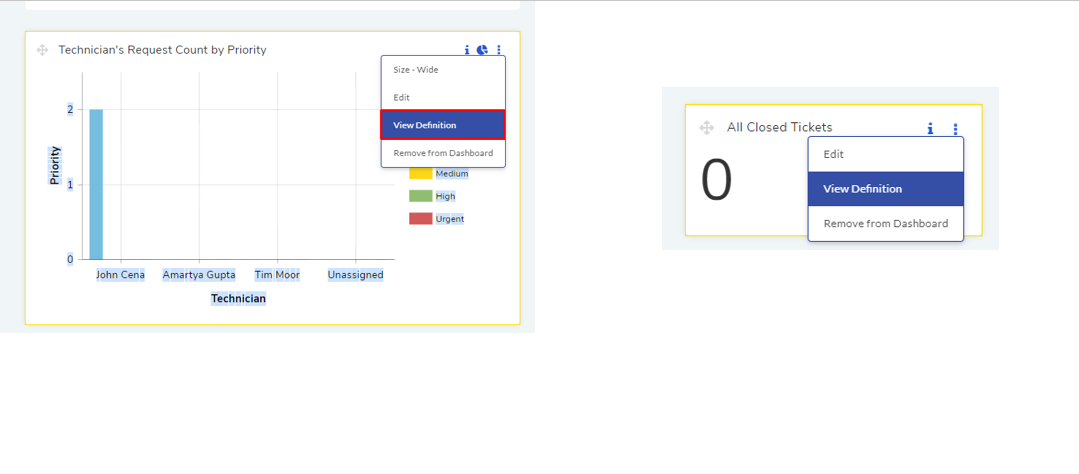
The definition dialog box shows the parameters and details of a KPI and Widget.
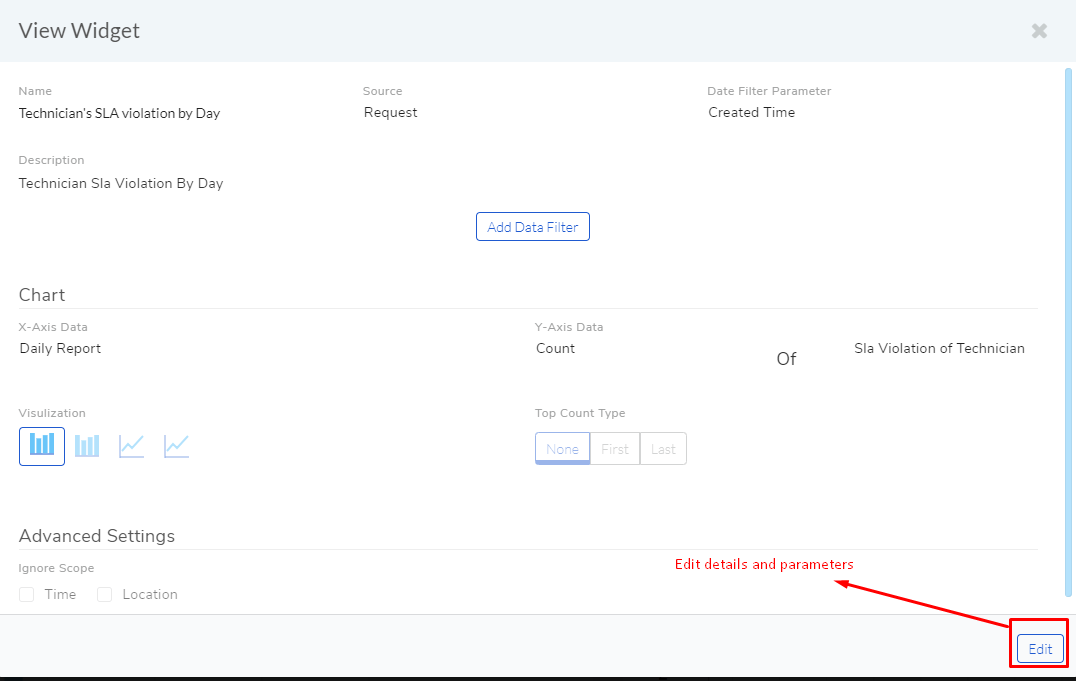
If you are an owner, a edit button will be visible on the definition box, which you can use to edit the details and parameters of a KPI and Widget.
You can also access the definition box from the Dashlet panel by clicking on the Dashlet name.
Note
Related topic: Learn how to create a Dashlet.
14.7.4. Sharing a Dashlet
Note
Predefined Dashlets are shared with all by default.
The following Dashlet types can be shared: KPIs and Widgets.
An owner can share a Dashlet when creating it and later from its definition. Sharing can be done with specific Technicians or a Group/Groups.
A shared Dashlet can only be viewed and added.
14.7.5. Create a Duplicate Dashlet
A user can create a duplicate of a Dashlet (barring Shortcuts). Duplicating a Dashlet has the following output:
A new Dashlet is created with all the parameters and details of the original Dashlet.
The user who created the duplicate becomes owner of the new Dashlet regardless of whether he/she is the owner of the original Dashlet.
The duplicate Dashlet is shared with the same people/groups as the original unless the owner changes the privacy settings of the duplicate.
To Create a Duplicate:
Open a Dashboard from the Dashboard List page and access the Dashlet panel by clicking Add Dashlet.
Barring from Shortcuts, all KPIs and Widgets have the duplicate icon. Click the duplicate icon of the Dashlet that you want to duplicate.
A dialog box opens where you can edit the following things:
Name of the Dashlet.
Data Filter Parameters.
Description of the Dashlet.
Data filter condition/conditions.
In widgets, you can change the default chart type, and the associated data and function with the axises.
Top count type.
Privacy and advance settings.
When done, click on Duplicate, and the new Dashlet will be added to the Dashlet panel.
14.7.6. Deleting a Dashlet
Note
Predefined Dashlets cannot be deleted by any user.
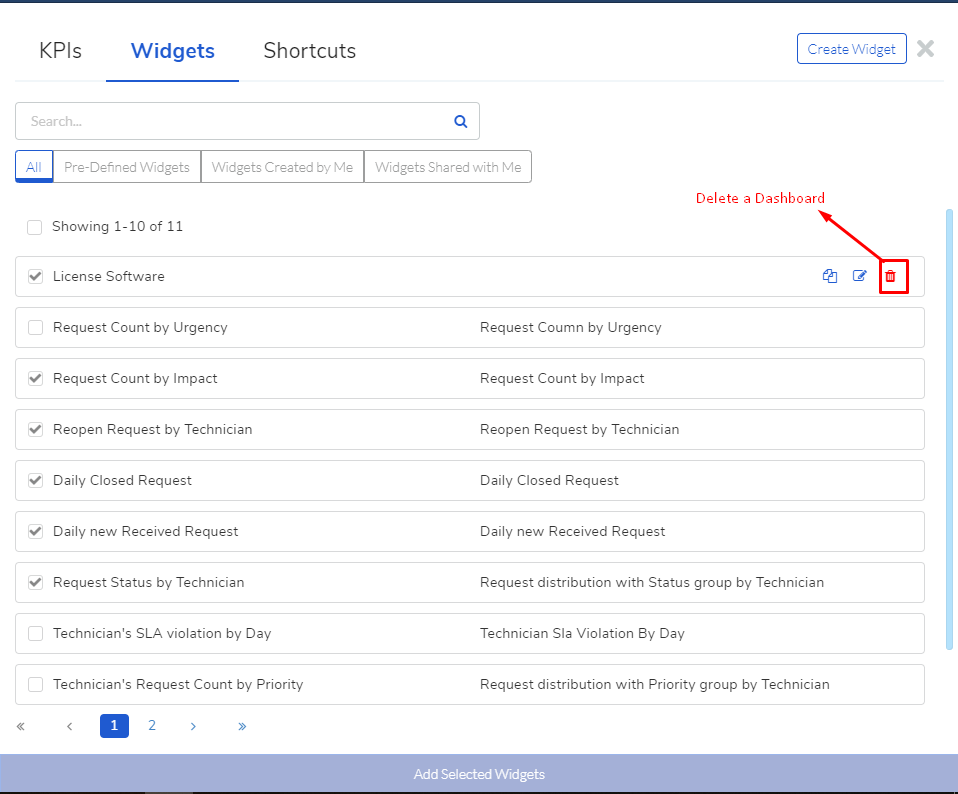
Owner of a custom Dashlet (KPI or widget) can delete it from the Dashlet panel.
14.7.7. Ignoring Time and Location Filters (Advanced Settings)
When editing a custom Dashlet (barring Shortcuts). You can make it ignore the time and Location filter of a Dashboard; the options are under the Advanced settings.