Linux
version: 8.9
Compatibility: v 7.7.5
Requires: Host/IP/CIDR/CSV (Mandatory), Port (Mandatory), Username (Mandatory), Password (Optional), Processes (Optional), Key File Name (Optional), Passphrase (Optional), Services (Optional), Metric Collect Interval (Mandatory)
Operation: Collects information from Linux devices.
Change from Last Version: Improvement: Packet Loss KPI is visible in GUI
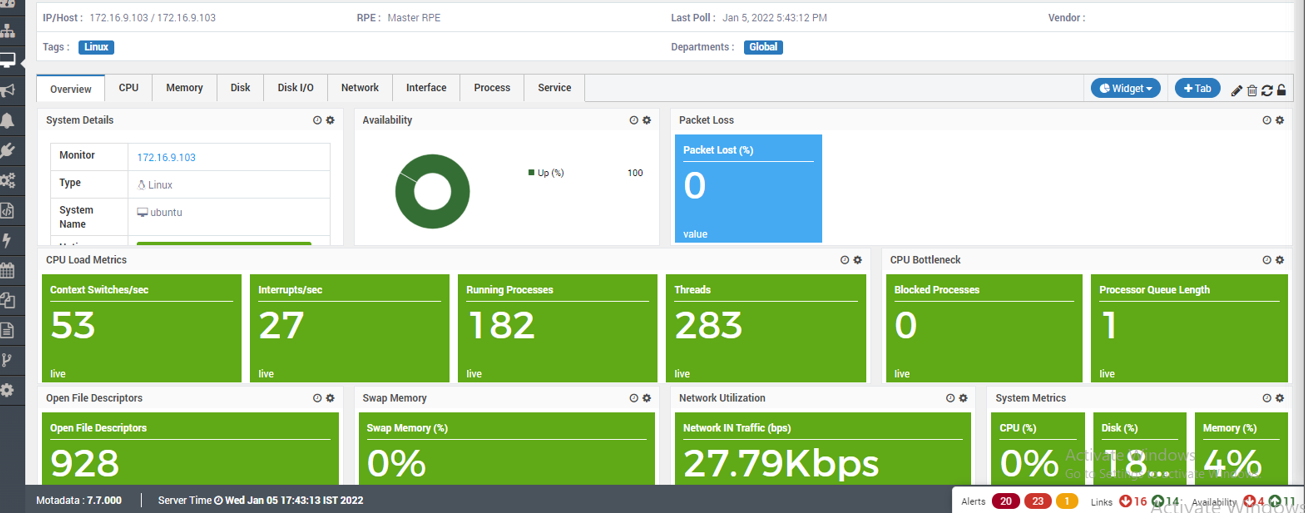
Linux Monitor
version: 8.8
Compatibility: v 7.7.0
Requires: Host/IP/CIDR/CSV (Mandatory), Port (Mandatory), Username (Mandatory), Password (Optional), Processes (Optional), Key File Name (Optional), Passphrase (Optional), Services (Optional), Metric Collect Interval (Mandatory)
Operation: Collects information from Linux devices.
Change from Last Version: Improvement: Packet Loss KPI is visible in GUI

Linux Monitor
version: 8.7
Compatibility: v 7.6.7
Requires: Host/IP/CIDR/CSV (Mandatory), Port (Mandatory), Username (Mandatory), Password (Optional), Processes (Optional), Key File Name (Optional), Passphrase (Optional), Services (Optional), Metric Collect Interval (Mandatory)
Operation: Collects information from Linux devices.
Change from Last Version: Improvement: New widget added

Linux Monitor
version: 8.6
Compatibility: v 7.6.5
Requires: Host/IP/CIDR/CSV (Mandatory), Port (Mandatory), Username (Mandatory), Password (Optional), Processes (Optional), Key File Name (Optional), Passphrase (Optional), Services (Optional), Metric Collect Interval (Mandatory)
Operation: Collects information from Linux devices.
Change from Last Version: Bug fix: Multiple Processes are now sorted.

Linux Monitor
version: 8.5
Compatibility: v 7.6.4
Requires: Host/IP/CIDR/CSV (Mandatory), Port (Mandatory), Username (Mandatory), Password (Optional), Processes (Optional), Key File Name (Optional), Passphrase (Optional), Services (Optional), Metric Collect Interval (Mandatory)
Operation: Collects information from Linux devices.
Change from Last Version: Improved Performance

Linux Monitor
version: 8.3
Compatibility: v 7.6.2
Requires: Host/IP/CIDR/CSV (Mandatory), Port (Mandatory), Username (Mandatory), Password (Optional), Processes (Optional), Key File Name (Optional), Passphrase (Optional), Services (Optional), Metric Collect Interval (Mandatory)
Operation: Collects information from Linux devices.
Change from Last Version: Addition of Flag for Duplication with values YES or NO. Default: NO

Linux Monitor
version: 8.2
Compatibility: v 7.6.1
Requires: Host/IP/CIDR/CSV (Mandatory), Port (Mandatory), Username (Mandatory), Password (Optional), Processes (Optional), Key File Name (Optional), Passphrase (Optional), Services (Optional), Metric Collect Interval (Mandatory)
Operation: Collects information from Linux devices.
Change from Last Version: Bug Fix: Improvement in Network Card details capture Logic
version: 8.1
Compatibility: v 7.6.0
Requires: Host/IP/CIDR/CSV (Mandatory), Port (Mandatory), Username (Mandatory), Password (Optional), Processes (Optional), Key File Name (Optional), Passphrase (Optional), Services (Optional), Metric Collect Interval (Mandatory)
Operation: Collects information from Linux devices.
Change from Last Version: New Feature: A widget showing the Password Expiry days is added.
version: 8.0
Compatibility: v 7.5.7
Requires: Host/IP/CIDR/CSV (Mandatory), Port (Mandatory), Username (Mandatory), Password (Optional), Processes (Optional), Key File Name (Optional), Passphrase (Optional), Services (Optional), Metric Collect Interval (Mandatory)
Operation: Collects information from Linux devices.
Change from Last Version: Bug fix: Validation for non-numeric values in numeric fields.
Plugin-Metrics:

Linux Monitor
Instance Metric |
Data Type |
RTT (ms): |
Numeric |
CPU (%): |
Numeric |
Idle CPU (%): |
Numeric |
User CPU (%): |
Numeric |
System CPU (%): |
Numeric |
I/O CPU (%): |
Numeric |
Interrupts/sec: |
Numeric |
Disk Capacity (MB): |
Numeric |
Used Disk (MB): |
Numeric |
Free Disk (MB): |
Numeric |
Disk (%): |
Numeric |
Installed Memory (MB): |
Numeric |
Used Memory (MB): |
Numeric |
Free Memory (MB): |
Numeric |
Memory (%): |
Numeric |
Overall Used Memory (MB): |
Numeric |
Overall Free Memory (MB): |
Numeric |
Overall Memory (%): |
Numeric |
Buffered Memory (MB): |
Numeric |
Cached Memory (MB): |
Numeric |
Swap Memory (MB): |
Numeric |
Used Swap Memory (MB): |
Numeric |
Free Swap Memory (MB): |
Numeric |
Swap Memory (%): |
Numeric |
System Uptime (Seconds): |
Numeric |
Uptime: |
String |
Vendor: |
String |
Model: |
String |
OS Name: |
String |
CPU Type: |
String |
System Name: |
String |
OS Version: |
String |
Processor Queue Length: |
Numeric |
Blocked Processes: |
Numeric |
Context Switches/sec: |
Numeric |
Open File Descriptors: |
Numeric |
CPU Cores: |
Numeric |
Running Processes: |
Numeric |
Temperature |
Numeric |
Threads: |
Numeric |
Network IN Traffic (bps): |
Numeric |
Network OUT Traffic (bps): |
Numeric |
Network Traffic (bps): |
Numeric |
Instance Metrics
|
|
Disk Volume: |
String |
Disk Volume Capacity (MB): |
Numeric |
Disk Volume Used (MB): |
Numeric |
Disk Volume Free (MB): |
Numeric |
Disk Volume Utilization (%): |
Numeric |
Disk Volume Mount Path: |
String |
Disk:
Disk: |
String |
Disk Reads/sec: |
Numeric |
Disk Writes/sec: |
Numeric |
Disk Byte Reads/sec: |
Numeric |
Disk Byte Writes/sec: |
Numeric |
Disk Queue Length: |
Numeric |
Disk I/O Time (%): |
Numeric |
Disk I/O Ops/sec: |
Numeric |
Disk Bytes/sec: |
Numeric |
Interface:
Interface: |
String |
Interface IN Traffic (bps): |
Numeric |
Interface OUT Traffic (bps): |
Numeric |
Interface Traffic (bps): |
Numeric |
Process:
Process: |
String |
Process User: |
String |
Process Id: |
Numeric |
Process Threads: |
Numeric |
Process CPU (%): |
Numeric |
Process CPU Time (%): |
Numeric |
Process Memory (KB): |
Numeric |
Process Instances: |
Numeric |
Process I/O (Bytes/sec): |
Numeric |
Service:
Service: |
String |
Service Status: |
String |
CPU Core:
CPU Core: |
Numeric |
CPU Core Interrupt (%): |
Numeric |
CPU Core I/O (%): |
Numeric |
CPU Core System (%): |
Numeric |
CPU Core User (%): |
Numeric |
CPU Core Idle (%): |
Numeric |
CPU Core Utilization (%): |
Numeric |
Data Models
primary: “Linux Metrics” instance:
name: “Linux Interface Metrics” columns: “Interface,Interface IN Traffic (bps),Interface OUT Traffic (bps),Interface Traffic (bps)”
name: “Linux Disk Metrics” columns: “Disk Volume,Disk Volume Capacity (MB),Disk Volume Free (MB),Disk Volume Used (MB),Disk Volume Utilization (%),Disk Volume Mount Path”
name: “Linux Disk I/O Metrics” columns: “Disk,Disk Byte Reads/sec,Disk Byte Writes/sec,Disk Writes/sec,Disk Reads/sec,Disk I/O Time (%),Disk Queue Length,Disk I/O Ops/sec,Disk Bytes/sec”
name: “Linux Process Metrics” columns: “Process,Process CPU (%),Process CPU Time (%),Process Memory (KB),Process Threads,Process Id,Process I/O (Bytes/sec),Process Instances”
name: “Linux Service Metrics” columns: “Service,Service Status”
name: “Linux CPU Core Metrics” columns: “CPU Core,CPU Core Interrupt (%),CPU Core I/O (%),CPU Core System (%),CPU Core User (%),CPU Core Idle (%),CPU Core Utilization (%)”
version: 7.9
Compatibility: v 7.5.5
Requires: Host/IP/CIDR/CSV (Mandatory), Port (Mandatory), Username (Mandatory), Password (Optional), Processes (Optional), Key File Name (Optional), Passphrase (Optional), Services (Optional), Metric Collect Interval (Mandatory)
Operation: Collects information from Linux devices.
Change from last version: Added support for IPv6
version: 7.6
Compatibility: v 7.5.4
Requires: Host/IP/CIDR/CSV (Mandatory), Port (Mandatory), Username (Mandatory), Password (Mandatory), Processes (Optional), Key File Name (Optional), Passphrase (Optional), Services (Optional), Metric Collect Interval (Second)
Operation: Collects information from Linux devices.
Change from last version: Bug fix - Linux service was running but showing stopped in GUI
version: 7.5
Compatibility: v 7.5.3
Requires: Host/IP/CIDR/CSV (Mandatory), Port (Mandatory), Username (Mandatory), Password (Mandatory), Processes (Optional), Key File Name (Optional), Passphrase (Optional), Services (Optional), Metric Collect Interval (Second)
Operation: Collects information from Linux devices.
Other Useful Commands
1.Cpu Details
mpstat -P ALL | awk ‘{print $11}’
if ‘idle’ string present in output of above command then - mpstat -P ALL 1 1 | grep -vE -i ‘Average’| awk ‘{print $11”” + ” ” + “”$4”” + ” ” + “”$6”” + ” ” + “”$7”” + ” ” + “”$8”” + ” ” + “”$3 }’ else
mpstat -P ALL | awk ‘{print $12}’
if ‘idle’ string present in output of above command then - mpstat -P ALL 1 1 | grep -vE -i ‘Average’| awk ‘{print $12”” + ” ” + “”$4”” + ” ” + “”$6”” + ” ” + “”$7”” + ” ” + “”$8”” + ” ” + “”$3}’ else - mpstat -P ALL | awk ‘{print $13}’
if ‘idle’ string present in output of above command then - mpstat -P ALL 1 1 | grep -vE -i ‘Average’| awk ‘{print $13”” + ” ” + “”$4”” + ” ” + “”$6”” + ” ” + “”$7”” + ” ” + “”$8”” + ” ” + “”$3}’ else - vmstat 1 3 | grep -v procs | grep -v r | awk {‘print $13”” + ” ” + “”$14”” + ” ” + “”$15’}
2.Logical Disk
df -l -k | grep -vE ‘^Filesystem|tmpfs|cdrom|none’ | awk ‘{ print $1”” + ” ” + “”$2”” + ” ” + “”$3”” + ” ” + “”$4”” + ” ” + “”$5”” + ” ” + “”$6}’
3.Memory
4.Uptime
cat /proc/uptime
5.Disk IO
iostat -d -xk | grep -vE ‘Linux|Device’ | awk ‘{print $14}’
if we get output for above command: - iostat -d -xk | grep -vE ‘Linux|Device’ |awk ‘{print $1”” + ” ” + “”$4”” + ” ” + “”$5”” + ” ” + “”$6”” + ” ” + “”$7”” + ” ” + “”$9”” + ” ” + “”$14}’
else
iostat -d -xk | grep -vE ‘Linux|Device’ |awk ‘{print $1”” + ” ” + “”$4”” + ” ” + “”$5”” + ” ” + “”$6”” + ” ” + “”$7”” + ” ” + “”$9”” + ” ” + “”$12}’
6.Network Card
cat /proc/net/dev | awk ‘{print $1” “$2” “$10}’
7.Running Process Detials
ps aux | wc -l
8.Thread Count
ps -eo nlwp | tail -n +2 | awk ‘{ num_threads += $1 } END { print num_threads }’
9.Vendor details
cat /proc/cpuinfo | awk ‘/vendor_id/ || /model name/’
os name -> command - ‘uname -o’ cpu type -> command - ‘uname -p’ system name -> command - ‘uname -n’ os version -> command - ‘uname -r’ Processor Queue Length, Blocked Processes, Interrupts/sec, Context Switches/sec -> command - vmstat | awk ‘{print $1” “$2” “$11” “$12}’ Open File Descriptors - cat /proc/sys/fs/file-nr | awk ‘{print $1}’ CPU Cores - cat /proc/cpuinfo | grep processor | wc -l
10.Set Password Expiry
chage -l “+user_name
11.Process details
top -b -n 1 -o -PID | awk ‘{print $12}’
top -b -n 1 -o -PID |grep ‘” + process_list + “’ | awk ‘{print $2” “$1” “$9” “$10” “$12}’
—-> where processList is comma separeted process name
For Process Below Command output is required:
command for process-memory-details -> free -m |grep -i mem |awk ‘{print $2}’
command for process-state-details -> pidstat -d | awk ‘{print $4” “$5” “$6}’
command for process-memory-details -> ps -e -T | awk ‘{print $1}’
12.Service Details
‘service –status-all’
Note
We either require a root user or any other equivalent sudo user for using the above commands.