Log Parser
Introduction
Logs are the raw information that Motadata collects from your network and display in search > Logs.
Log Parser Menu
Actual Flow:
Forward or upload log into Motadata host > Worker will read it and send to lucene and clickhouse simultaneously.
Additional Information/Technology
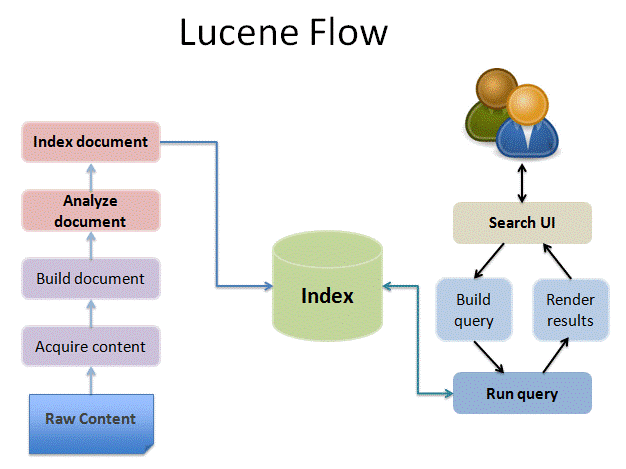
Lucene Flow
The above diagram shows how Lucene works.
Lucene is a full-text search library based on Java which helps us with easy to add/use search functionality. It does so by adding content to a full-text index.
We have a clickhouse database that stores the log data. This data is displayed in log widget and in search > log.
Trend (graph) in search > log is generated from clickhouse data.
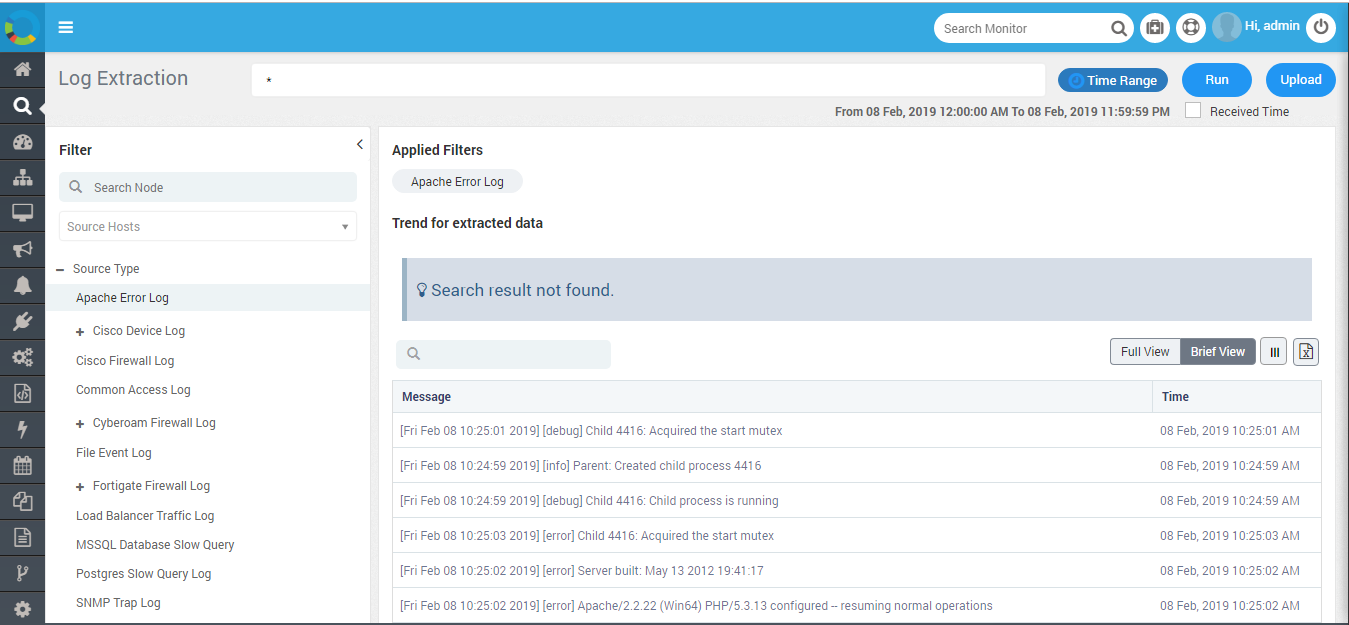
The graph is created from the clickhouse data. The table (below graph) is created from the mixed data of Lucene and clickhouse. This is because all logs first fall in Lucene. Motadata takes some time in transferring data from Lucene to clickhouse. Hence for the data in table, Motadata evaluates the time range for which logs are required and looks in clickhouse. After extracting the data from there, it also looks in Lucene to find any additional data.
You can verify the graph output by running a query in the clickhouse database. Use the query: select * from <table_name> where event_time > ‘<start_time>’ and event_time <’<end_time>’.
Prerequisites
Universal log parser plugin should be up to date.
Log engine should be ‘yes’ in motadata-config file in motadata/motadata/config
Required source type should be enabled from admin > universal log parser rules
Enabled/disabled entry (from admin section) will reflect in rules.json
Source host entry displaying will be of today
Source host entry in log widget will be of today and in order to get all source host data you need to select source host in group by with proper time range
User should be access to source hosts IP from admin > data security > Log/Flow/Trap
Search > Log will display today row data according to source host IP. It will display old data only when you keep source host as ALL
Lucene is responsible for search > Log row data display.
Current Logical Flow
Search

Search Bar
You can use search to filter your log data. By default we use * that tends to ‘All’ to fetch log data. You can also use below operations to collect logs:
AND
OR
Time Range: Search filter will fetch data as per the time range selected.
Received time: In logs there are two timespan displayed:
Event Time: The time when the log was actually generated.
Received Time: The time when the log was received to Motadata.
The received time checkbox just below run plays an important role here. Motadata will render logs for the time range only when the received time is checked.
For example: There is an error at 2PM for apache but Motadata was able to receive it at 2:05 PM. To check it if you put the time range as 1PM-2PM, you will not find it. But if you put time range as 1PM-3PM and check the received time checkbox, you will find the logs with the received time details.
Same applies for upload logs. You will be able to get your logs only when the received time for the time range is proper.
Full view: To view full message of the logs.
Brief view: To view message in brief.
Source Host
Source host is the host from where logs get parsed into Motadata
In Search > Log > It will display only today’s forwarded source host IP as its Motadata flow since beginning.
Same in Log widget > Source host will display only today’s entry next to source host filter.
In order to view old source host data in log widget > You can search group by source host.
As we know that in search > Log, we are able to view only today’s source hosts IP due to long delay in iteration process but we will able to see all old data in search > Log while keeping source host as ‘All’
And in order to view old source host IP and data in search > Log, there is only one possibility that if the same source host send log to Motadata i.e. it will forward log of today’s date, it will be listed in source host IP.
Search Node
It’s basically log patents/child which are displaying in left panel in search > Log screen. Enabling/disabling of parent/child can be managed from Admin > Log parser rules. Any changes made in admin > Log parser rules will reflect in “rules.json” file that is placed in below path:
/motadata/motadata/plugins/log-parser/universal-log-parser
Other
We have a node “other” as well at last in node list that has specific use as below:
Log will fall into other category if we don’t have the node enabled from admin > log parser rules
Log will fall into other category if we don’t have such node listed in the list of admin > log parser rules.
Show/Hide: You can show/hide columns to view info as per choice.
Upload
Below are the prerequisites to use upload functionality in Motadata:
In motadata/motadata/config/motadata-conf.yml -> motadata-agent: yes
In motadata/motadata/log-watcher-service.yml -> log-dirs: “/motadata/motadata/uploaded-log” (Provide the path where logs will be uploaded. This is the default path)
In motadata/motadata/agent.yml -> motadata-server-port: 5142 (Provide the port value. This is the default port)
In motadata/motadata/agent.yml -> motadata-server-host: localhost (Provide the host value. This is the default host)
As of now we don’t have any validation but its recommended to use .log file to upload any logs into Motadata. It’s raised but is marked as known and will be taken care of in future MOTADATA-2543.
Here also log will parse into “other” if not able to identify its category/node.
Export
You can export your logs in CSV format with all the info displaying in GUI. If you have logs less than 1,00,000 then they can be exported instantly but if they are more than 1,00,000 then they will be scheduled and fragmented into a zip. An email will be sent to the admin with the path to extract the zip.
Below is the default path to extract zip:
motadata/motadata/report
As of now we have tested for total more than 50 lacs logs where log screen along with export is working fine.
For a particular source node e.g.: syslog, we have exported logs for more than 4 lacs which is working fine.
Motadata Health Screen for Log
You can monitor log from Motadata health screen. It will display log volume and log/sec.
Log Volume (MB): The snippet shows total log volume processed on present/current day in MB in Motadata. If you click on the snippet, you’ll see the log volume for specific date and time.
Logs/Sec: The snippet shows live value of log processed by Motadata per second. If you click on the snippet, you’ll see the logs per second for specific date and time.
Statics
You can monitor logs/sec with time from motadata/motadata/log/ MOTADATA-STATISTICS.log
file-position.yml
This file will provide you info that how many files got uploaded into Motadata along with the logs count at the time of upload.
Path: motadata/motadata