4. Dashboards
Dashboard uses widgets to give you quick view of activities in different time ranges. The dashboard is like a customized Home menu where you can create and see widgets of your interest. You can add activities related service performance and infrastructure. Also, you can create multiple dashboards, each containing up to 20 widgets. You can choose any widget from the widget list (See Widget Details) may that be a graph to understand the trends or a table to see exact values of the parameters. Hence, all you can keep all the important monitoring attributes at one place for quick visualization. You can choose from pre-defined metrics or create a new metric using the widgets. With drag and drop feature, you can manage the view of the dashboard that would be specific for you.
The widgets display the specific information in the form of a pie chart, bar diagram, line diagram or as a list. These widgets can be concealed and rearranged in the canvas. Further, additional information can be obtained by hovering over the bar diagram or pie chart on the widget. For more information about widgets, click here.
Public Dashboards appear in all the configured Business Units in the application. Any changes made in the public dashboard (adding new widgets or removing a widget) of one business unit, effects the dashboard of all other configured Business Unit. You can customize dashboard if you are Admin or have necessary permissions to do so.
Features of Dashboard
Note
If you have enabled multi-tenancy through Business Unit, select the Unit to create a dashboard and then proceed with the dashboard configurations.
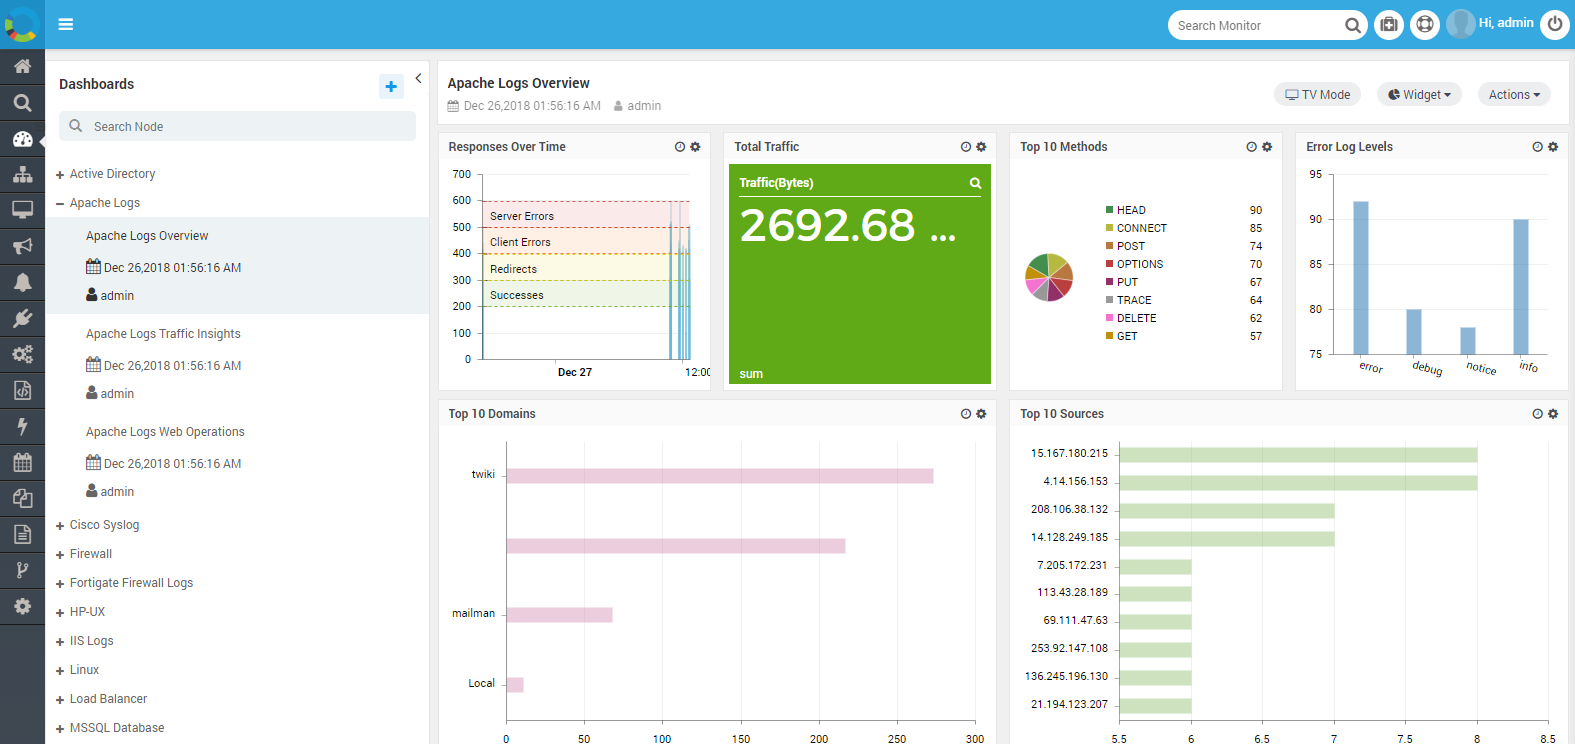
Sample Dashboard View