Create Alerts in Motadata
In Motadata we keeps the track of each monitor for your network. For every monitor, we have defined some thresholds based on their activity. The thresholds have conditional values that is compared against the activity of the monitor. When monitor’s activity crosses the condition value, Motadata alarms you about it. You can manage these thresholds and the condition values in the Alerts section. An alert contains different thresholds to notify you about the different level of activities of a monitor. Each threshold has one condition and many actions against associated with it. For example: In a warning threshold, you have set a condition that when a CPU process is more than 30%, a GUI notification should show as an action.
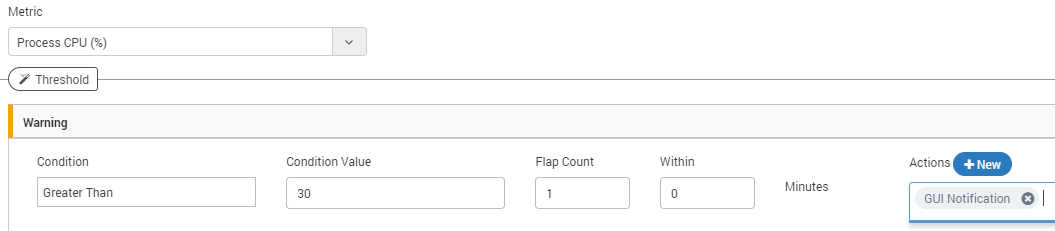
Example Alert Condition and Action
At every poll, Motadata fetches the monitor details and check it’s CPU process. It evaluates the CPU process with the alert condition for that monitor. When Motadata finds that CPU process is greater than 30%, it will display a UI alert.
What Alerts Screen Offers?
The alerts menu is dedicated to create and manage alerts. By default, Motadata gives you the pre-defined alerts for all monitor types. You can use the alerts as they are or you can modify them. If you want an alert but you don’t see it in the list, you can create a new alert. Motadata uses these alerts to identify the states of monitors. All other menus in Motadata uses the results of these alerts and shows you the data.
Alerts menu have 3 sections for: monitors, flow/logs and traps respectively. The menu is divided in these sections for two reasons: 1) You can find the alert easily. 2) While creating the alert, all the options and fields are alert specific only. For example: flow alert page will show only flow alerts. When you are creating a flow alert, Motadata will show only flow related fields.
Segments of Alerts
Monitor Alerts: Monitors are the entities that has an IP address. The page enlists all the alerts available for the monitors. In this tab, you can do following things:
Manage Alerts: Create, edit and delete the alerts.
Actions for Alerts: Select what you want to do with alerts: enable, disable, delete, suppress or un-suppress.
Group Alerts: Either you can group alerts monitor wise or disable grouping.
Flow/Log Alerts: Flow and logs are the messages that are generated due to network activity. The page enlists all the alerts available for the monitors. In this tab, you can do following things:
Manage Alerts: Create, edit and delete the alerts.
Actions for Alerts: Select what you want to do with alerts: enable, disable, delete, suppress or un-suppress.
Group Alerts: Either you can group alerts monitor wise or disable grouping.
Trap Alerts: Trap is the information that tells about change in network settings. The page enlists all the alerts available for the monitors. In this tab, you can do following things:
Manage Alerts: Create, edit and delete the alerts.
Actions for Alerts: Select what you want to do with alerts: enable, disable, delete, suppress or un-suppress.